PowerPoint presentation on the building blocks and features of the environment data portals.
PowerPoint presentation with tips on good practices, when uploading data to the environment data portals.
The increased demand for high quality products in export markets, coupled with Pacific Island Countries (PICs) national desire to protect the environment, biodiversity and family farming structures, lead to assume that organic agriculture could offer good prospects for PICs development. Besides market opportunities, organic agriculture could increase PICs food self-reliance and thus, contribute to reducing the alarming trend of dependency on food imports, as well as improving nutrition.
End of SPREP internship presentation, July 2015. Sections: climate finance challenges, overview of climate finance in the Pacific, and next steps.
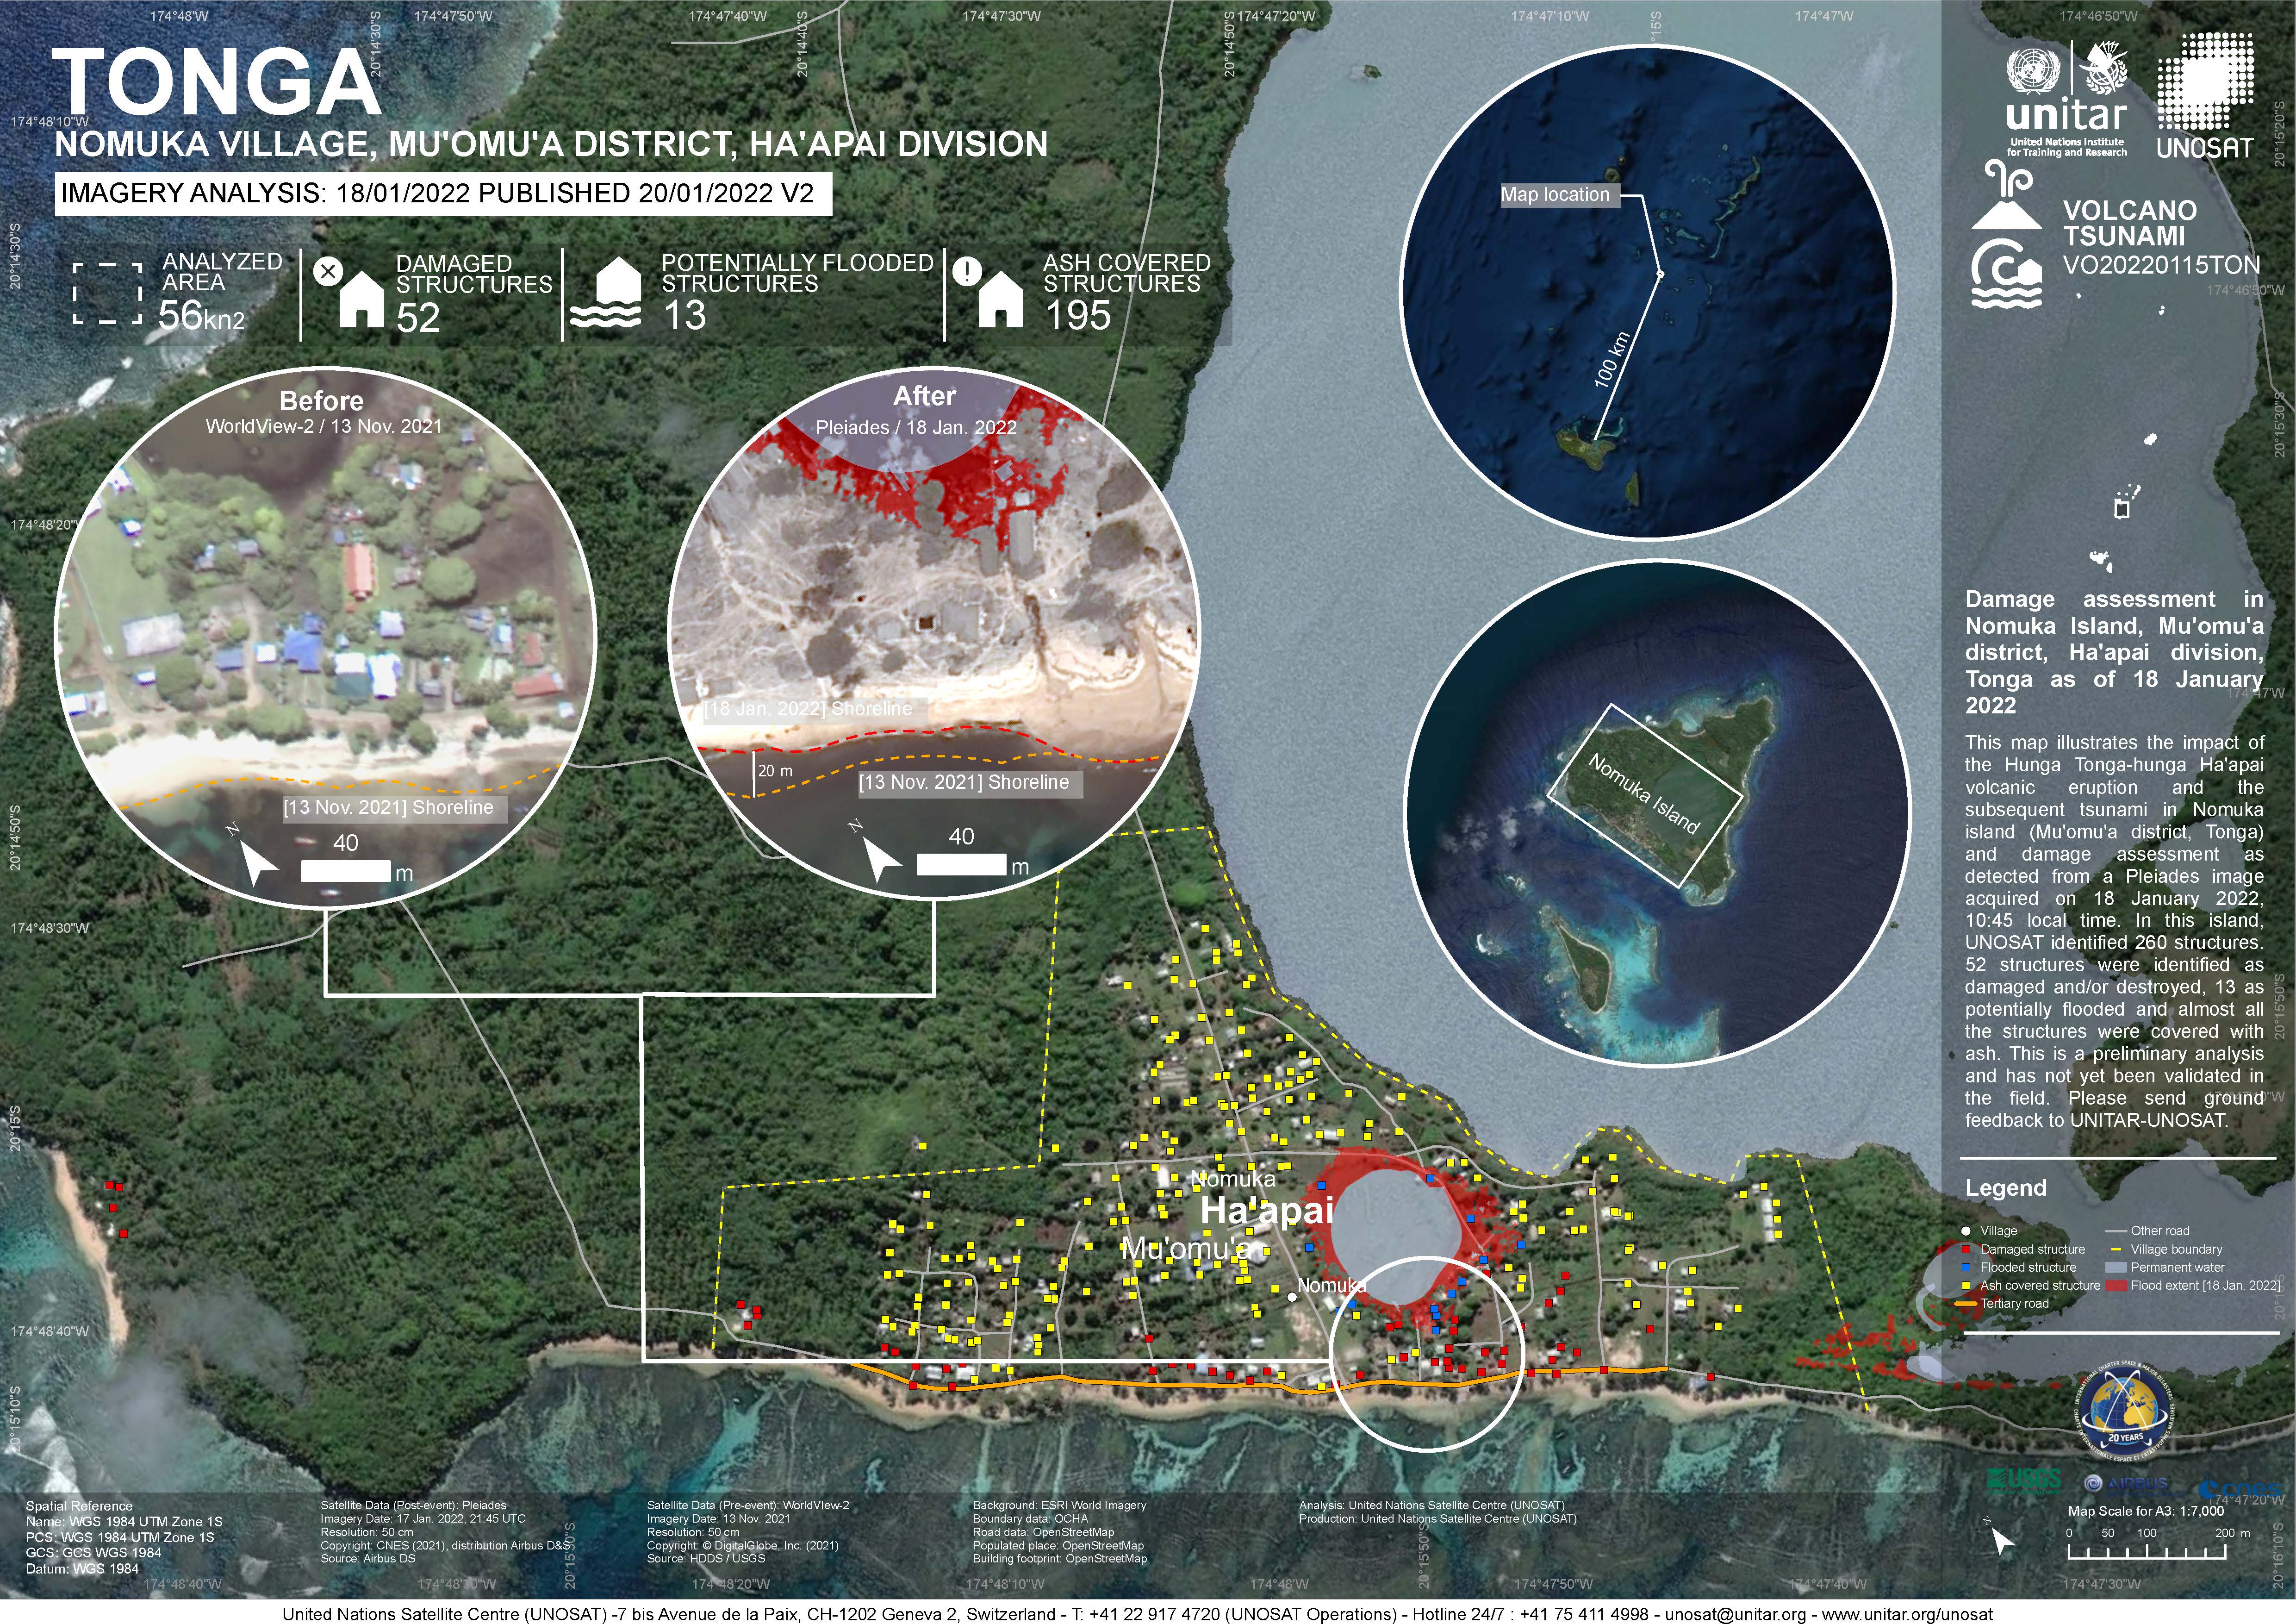
Damage assessment as detected from a Pleiades image acquired on 18 January 2022 in Nomuka Island (Mu'omu'a district, Tonga).
260 structures identified, 52 structures were identified as damaged and/or destroyed, 13 as potentially flooded and almost all structures were covered with ash. This is a preliminary analysis and has not yet been validated in the field
A collection of Inform project training materials. You are free to download and use any of the training resources below. The PowerPoint presentations contain a complete set of slides, so please feel free to copy, delete or change slides, to fit the purpose of your country training.
Reefs at Risk Revisited is a high-resolution update of the original global analysis, Reefs at Risk: A Map-Based Indicator of Threats to the World’s Coral Reefs. Reefs at Risk Revisited uses a global map of coral reefs at 500-m resolution, which is 64 times more detailed than the 4-km resolution map used in the 1998 analysis, and benefits from improvements in many global data sets used to evaluate threats to reefs (most threat data are at 1 km resolution, which is 16 times more detailed than those used in the 1998 analysis).
From the Turtle Research and Monitoring Database System (TREDS)
From the Turtle Research and Monitoring Database System (TREDS)
From the Turtle Research and Monitoring Database System (TREDS)
From the Turtle Research and Monitoring Database System (TREDS)
From the Turtle Research and Monitoring Database System (TREDS)
From the Turtle Research and Monitoring Database System (TREDS)
The SPREP ID map is a high resolution (1MB) that shows SPREP member countries with their Exclusive Economic Zone (EEZ) boundaries developed by the GIS team at SPREP.
The SPREP ID map is low resolution (200KB) that shows SPREP member countries with their Exclusive Economic Zone (EEZ) boundaries developed by the GIS team at SPREP.
The map is high resolution showing SPREP member countries' Exclusive Economic Zone (EEZ) boundaries overlaid on a bathymetric base layer that was developed by the GIS team at SPREP.
The map is low resolution showing SPREP member countries' Exclusive Economic Zone (EEZ) boundaries overlaid on a bathymetric base layer that was developed by the GIS team at SPREP.
Maps and associated data from the Turtle Research and Monitoring Database System (TREDS). A summary of the database can be found below.
The Turtle Research and Monitoring Database System (TREDS) provides invaluable information for Pacific island countries and territories to manage their turtle resources. TREDS can be used to collate data from strandings, tagging, nesting, emergence and beach surveys as well as other biological data on turtles.