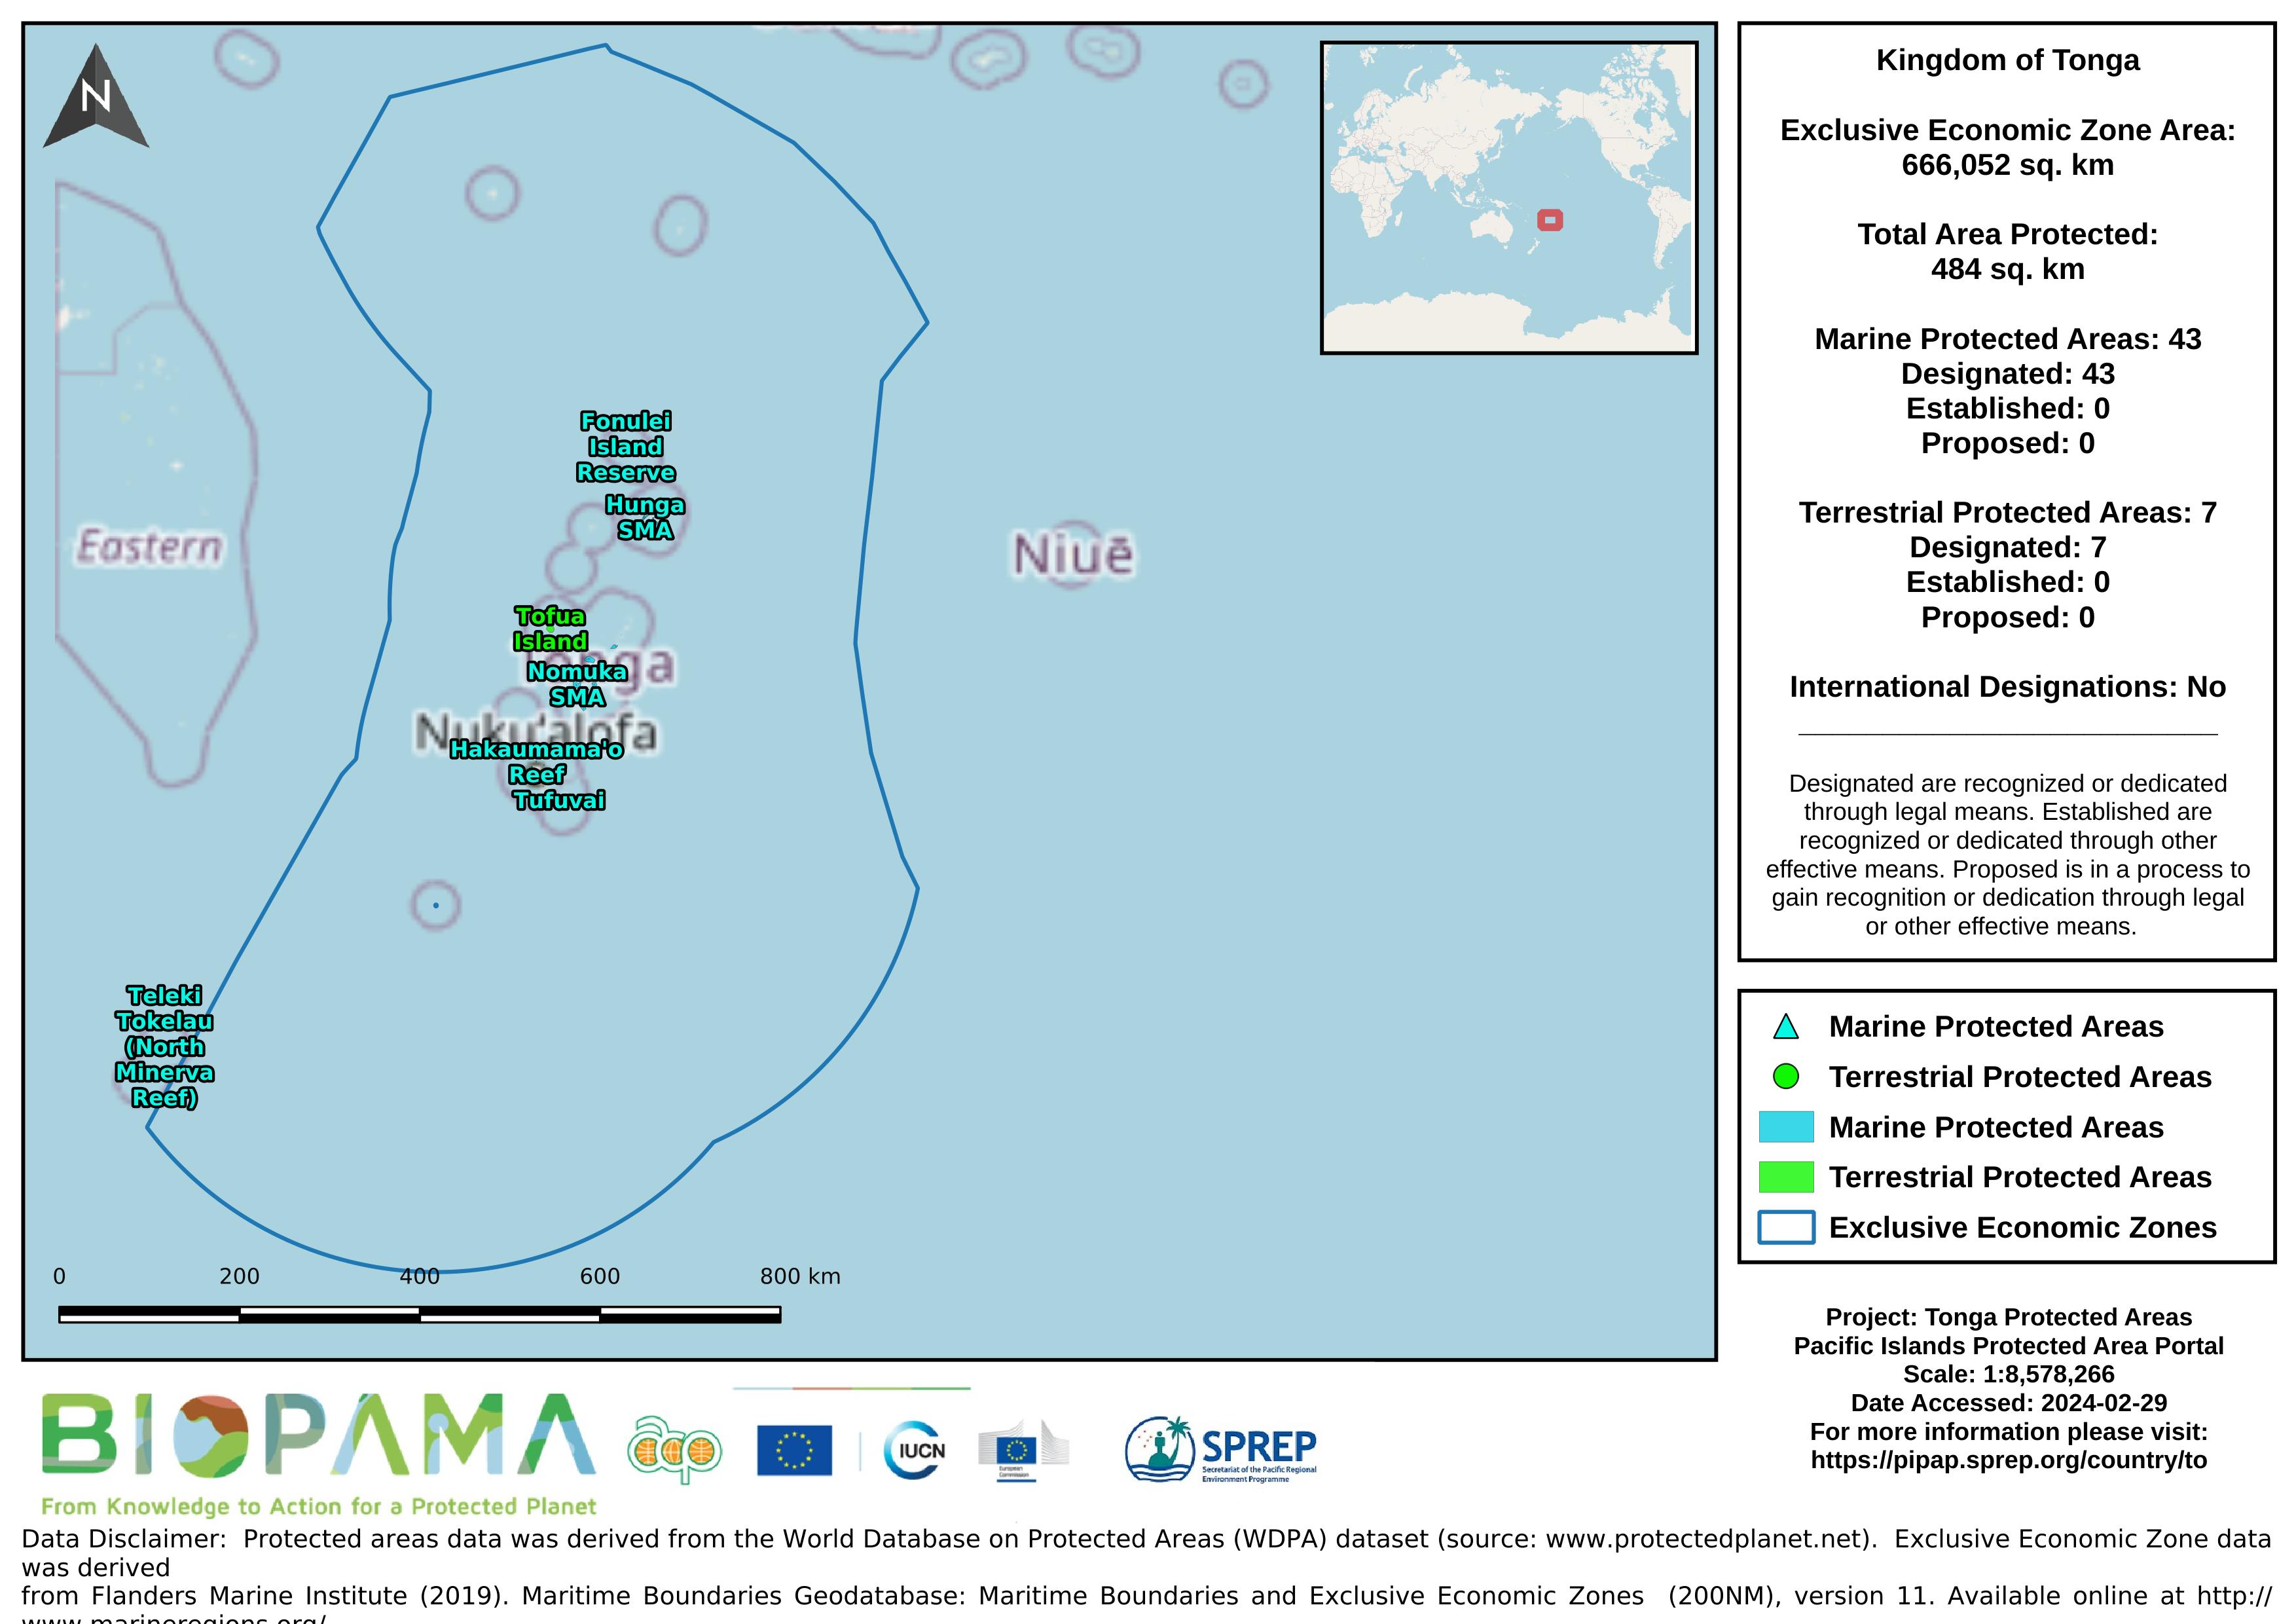
Map of the protected areas for Tonga with country-level summary statistics on the amount of area under protection, count for each type of protected area (terrestrial or marine), and the count of their designation.
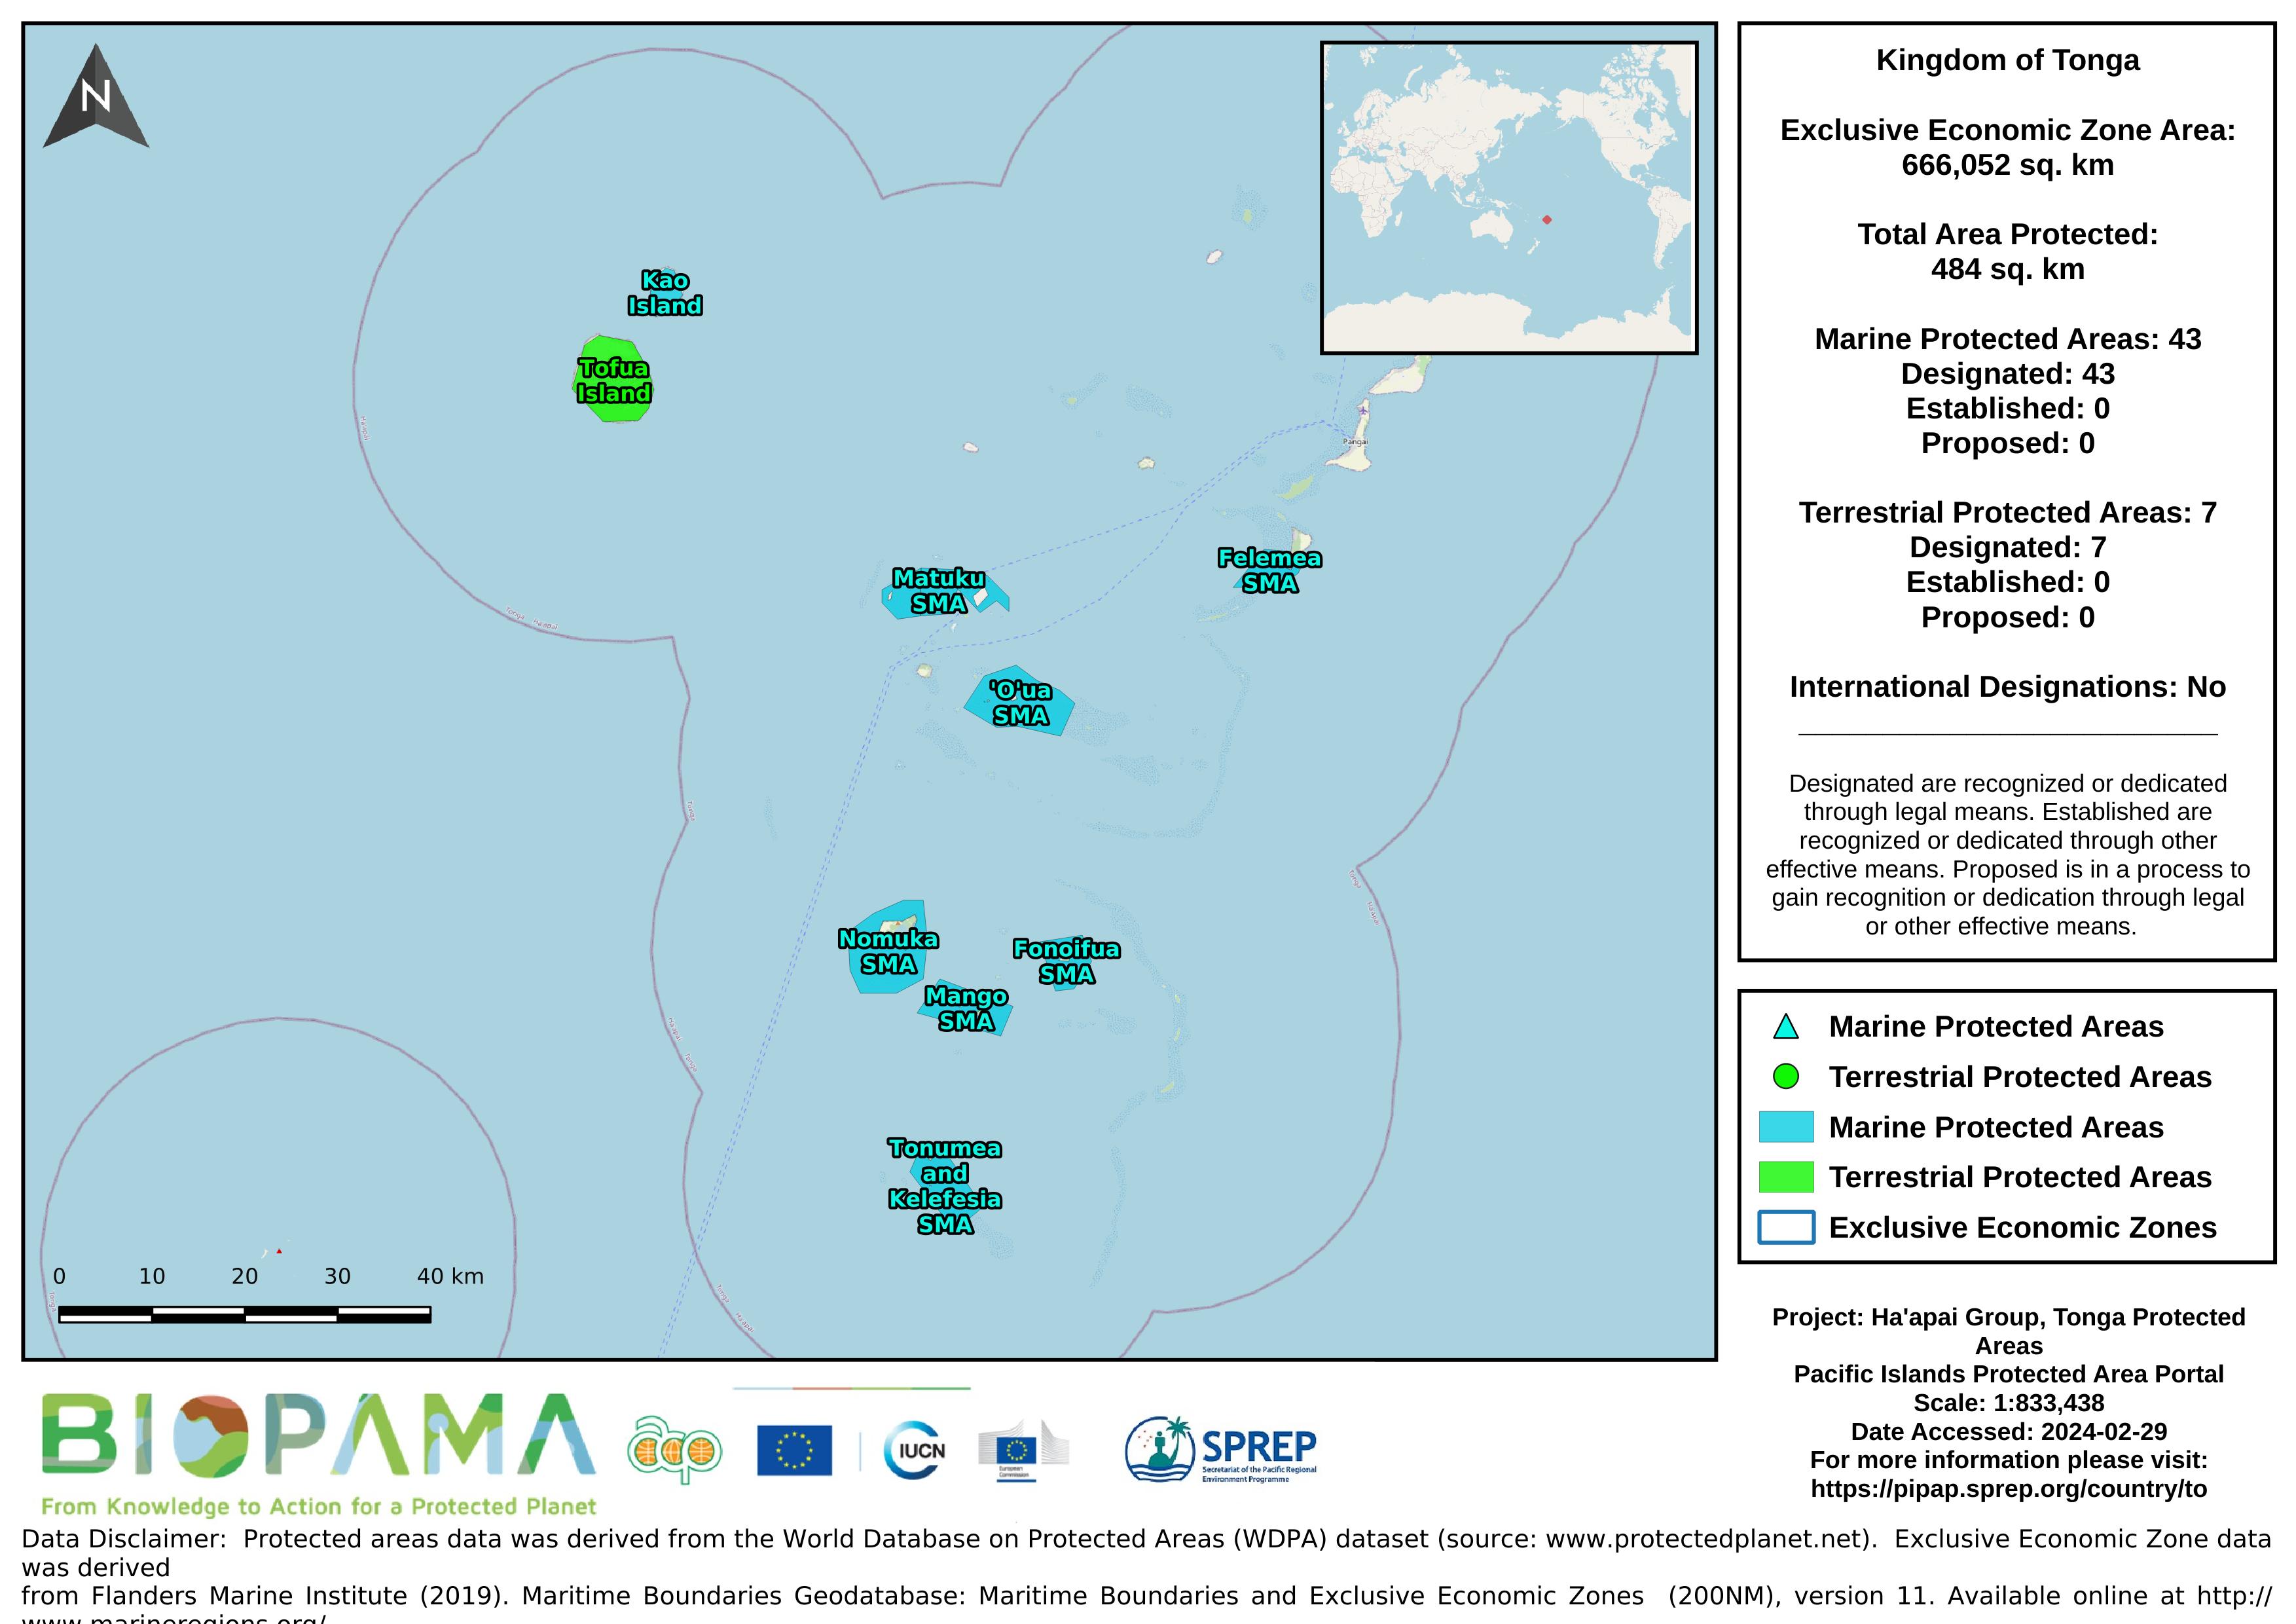
Map of the protected areas for the Ha'apai Group, Tonga with country-level summary statistics on the amount of area under protection, count for each type of protected area (terrestrial or marine), and the count of their designation.
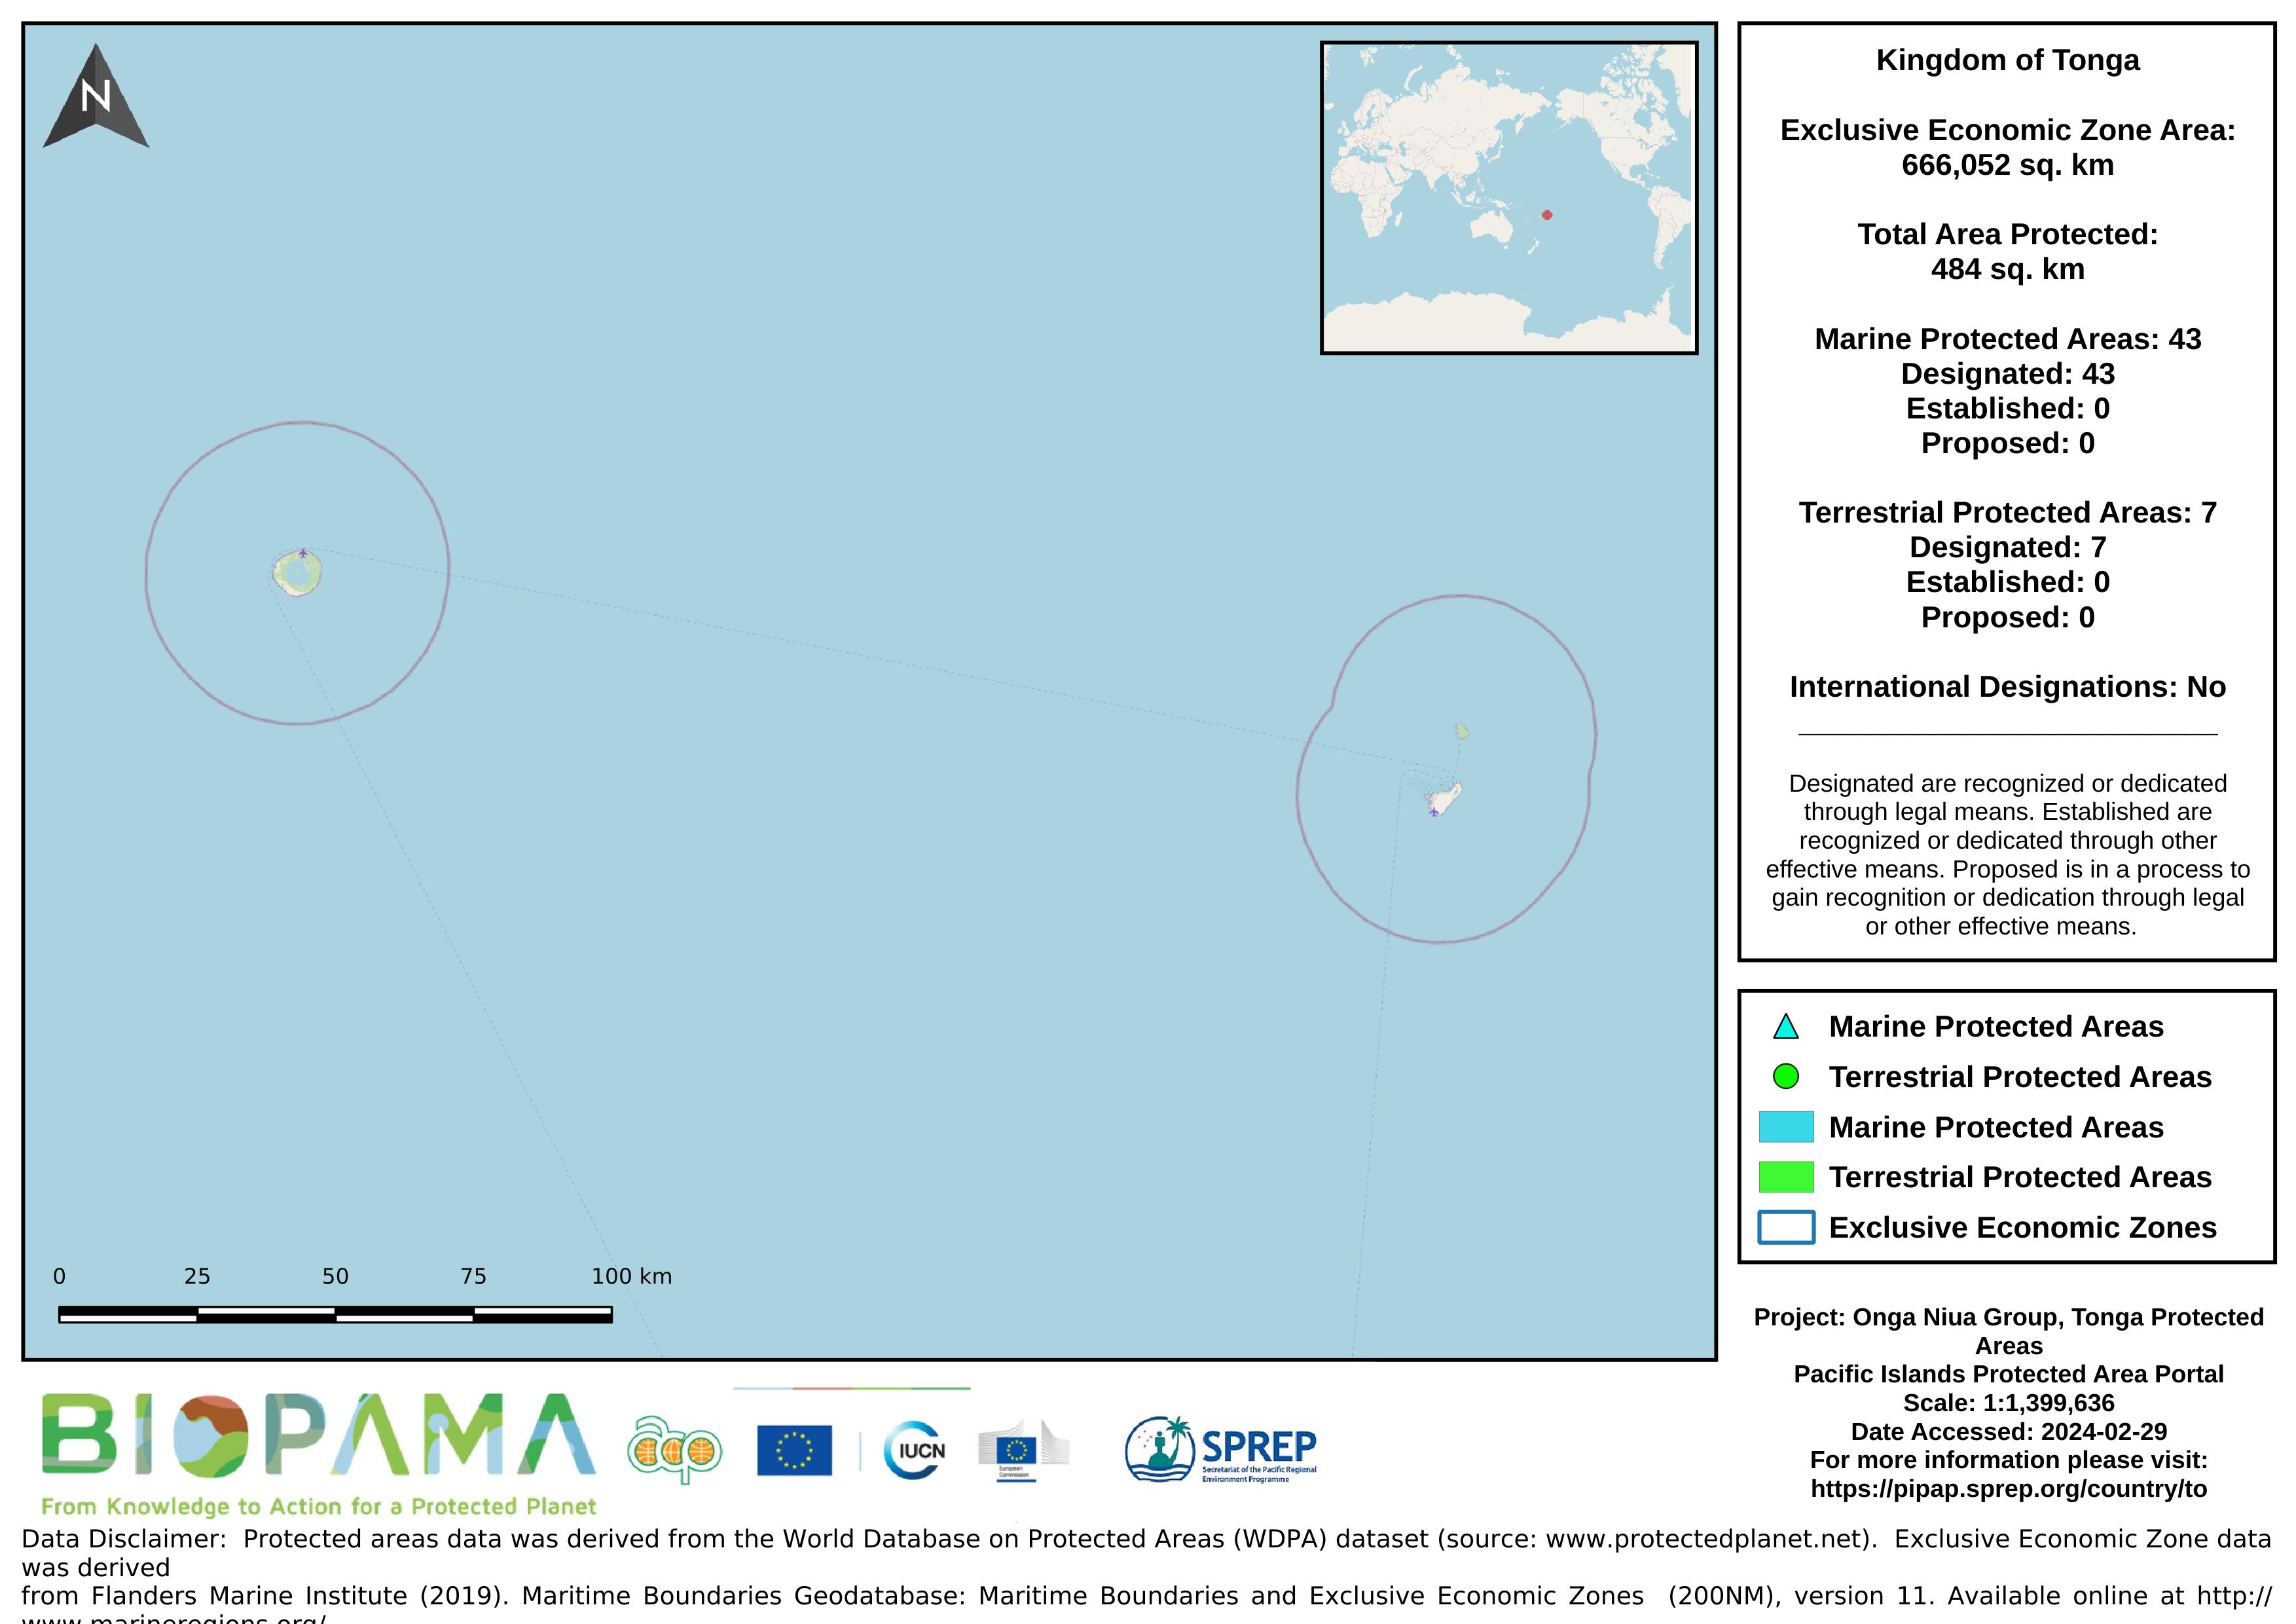
Map of the protected areas for the Niuas Group, Tonga with country-level summary statistics on the amount of area under protection, count for each type of protected area (terrestrial or marine), and the count of their designation.
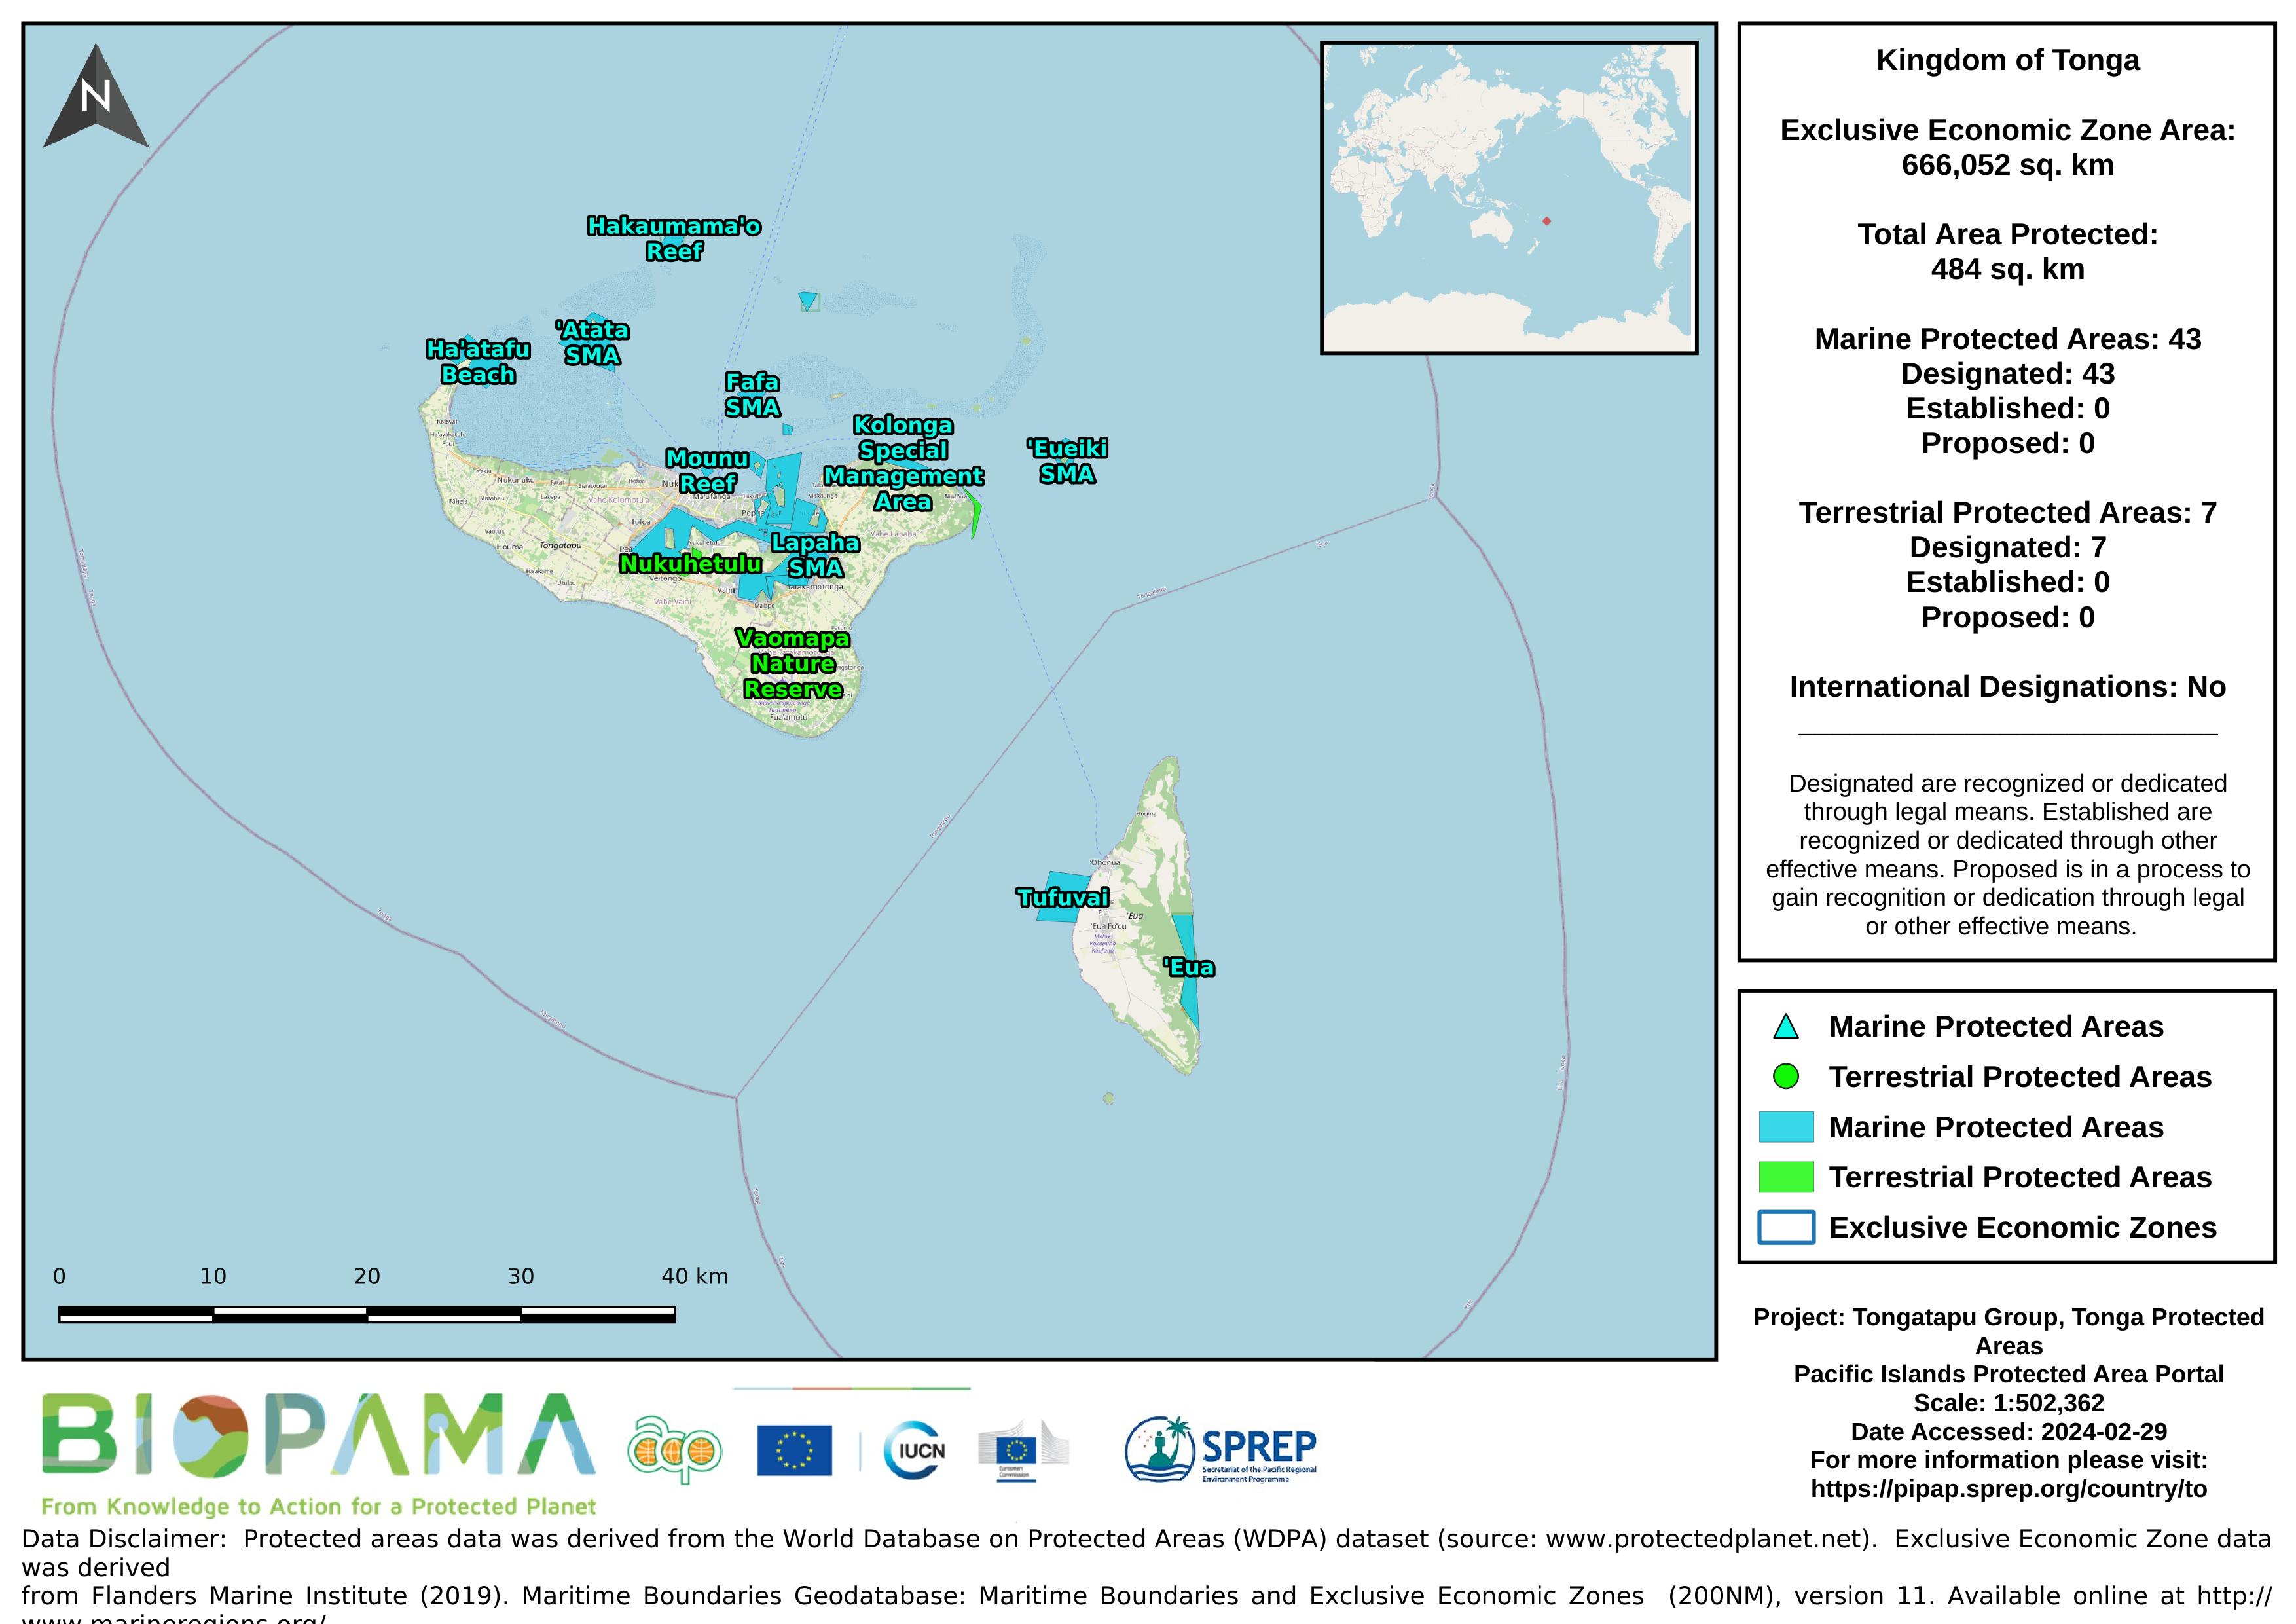
Map of the protected areas for the Tongatapu Group, Tonga with country-level summary statistics on the amount of area under protection, count for each type of protected area (terrestrial or marine), and the count of their designation.
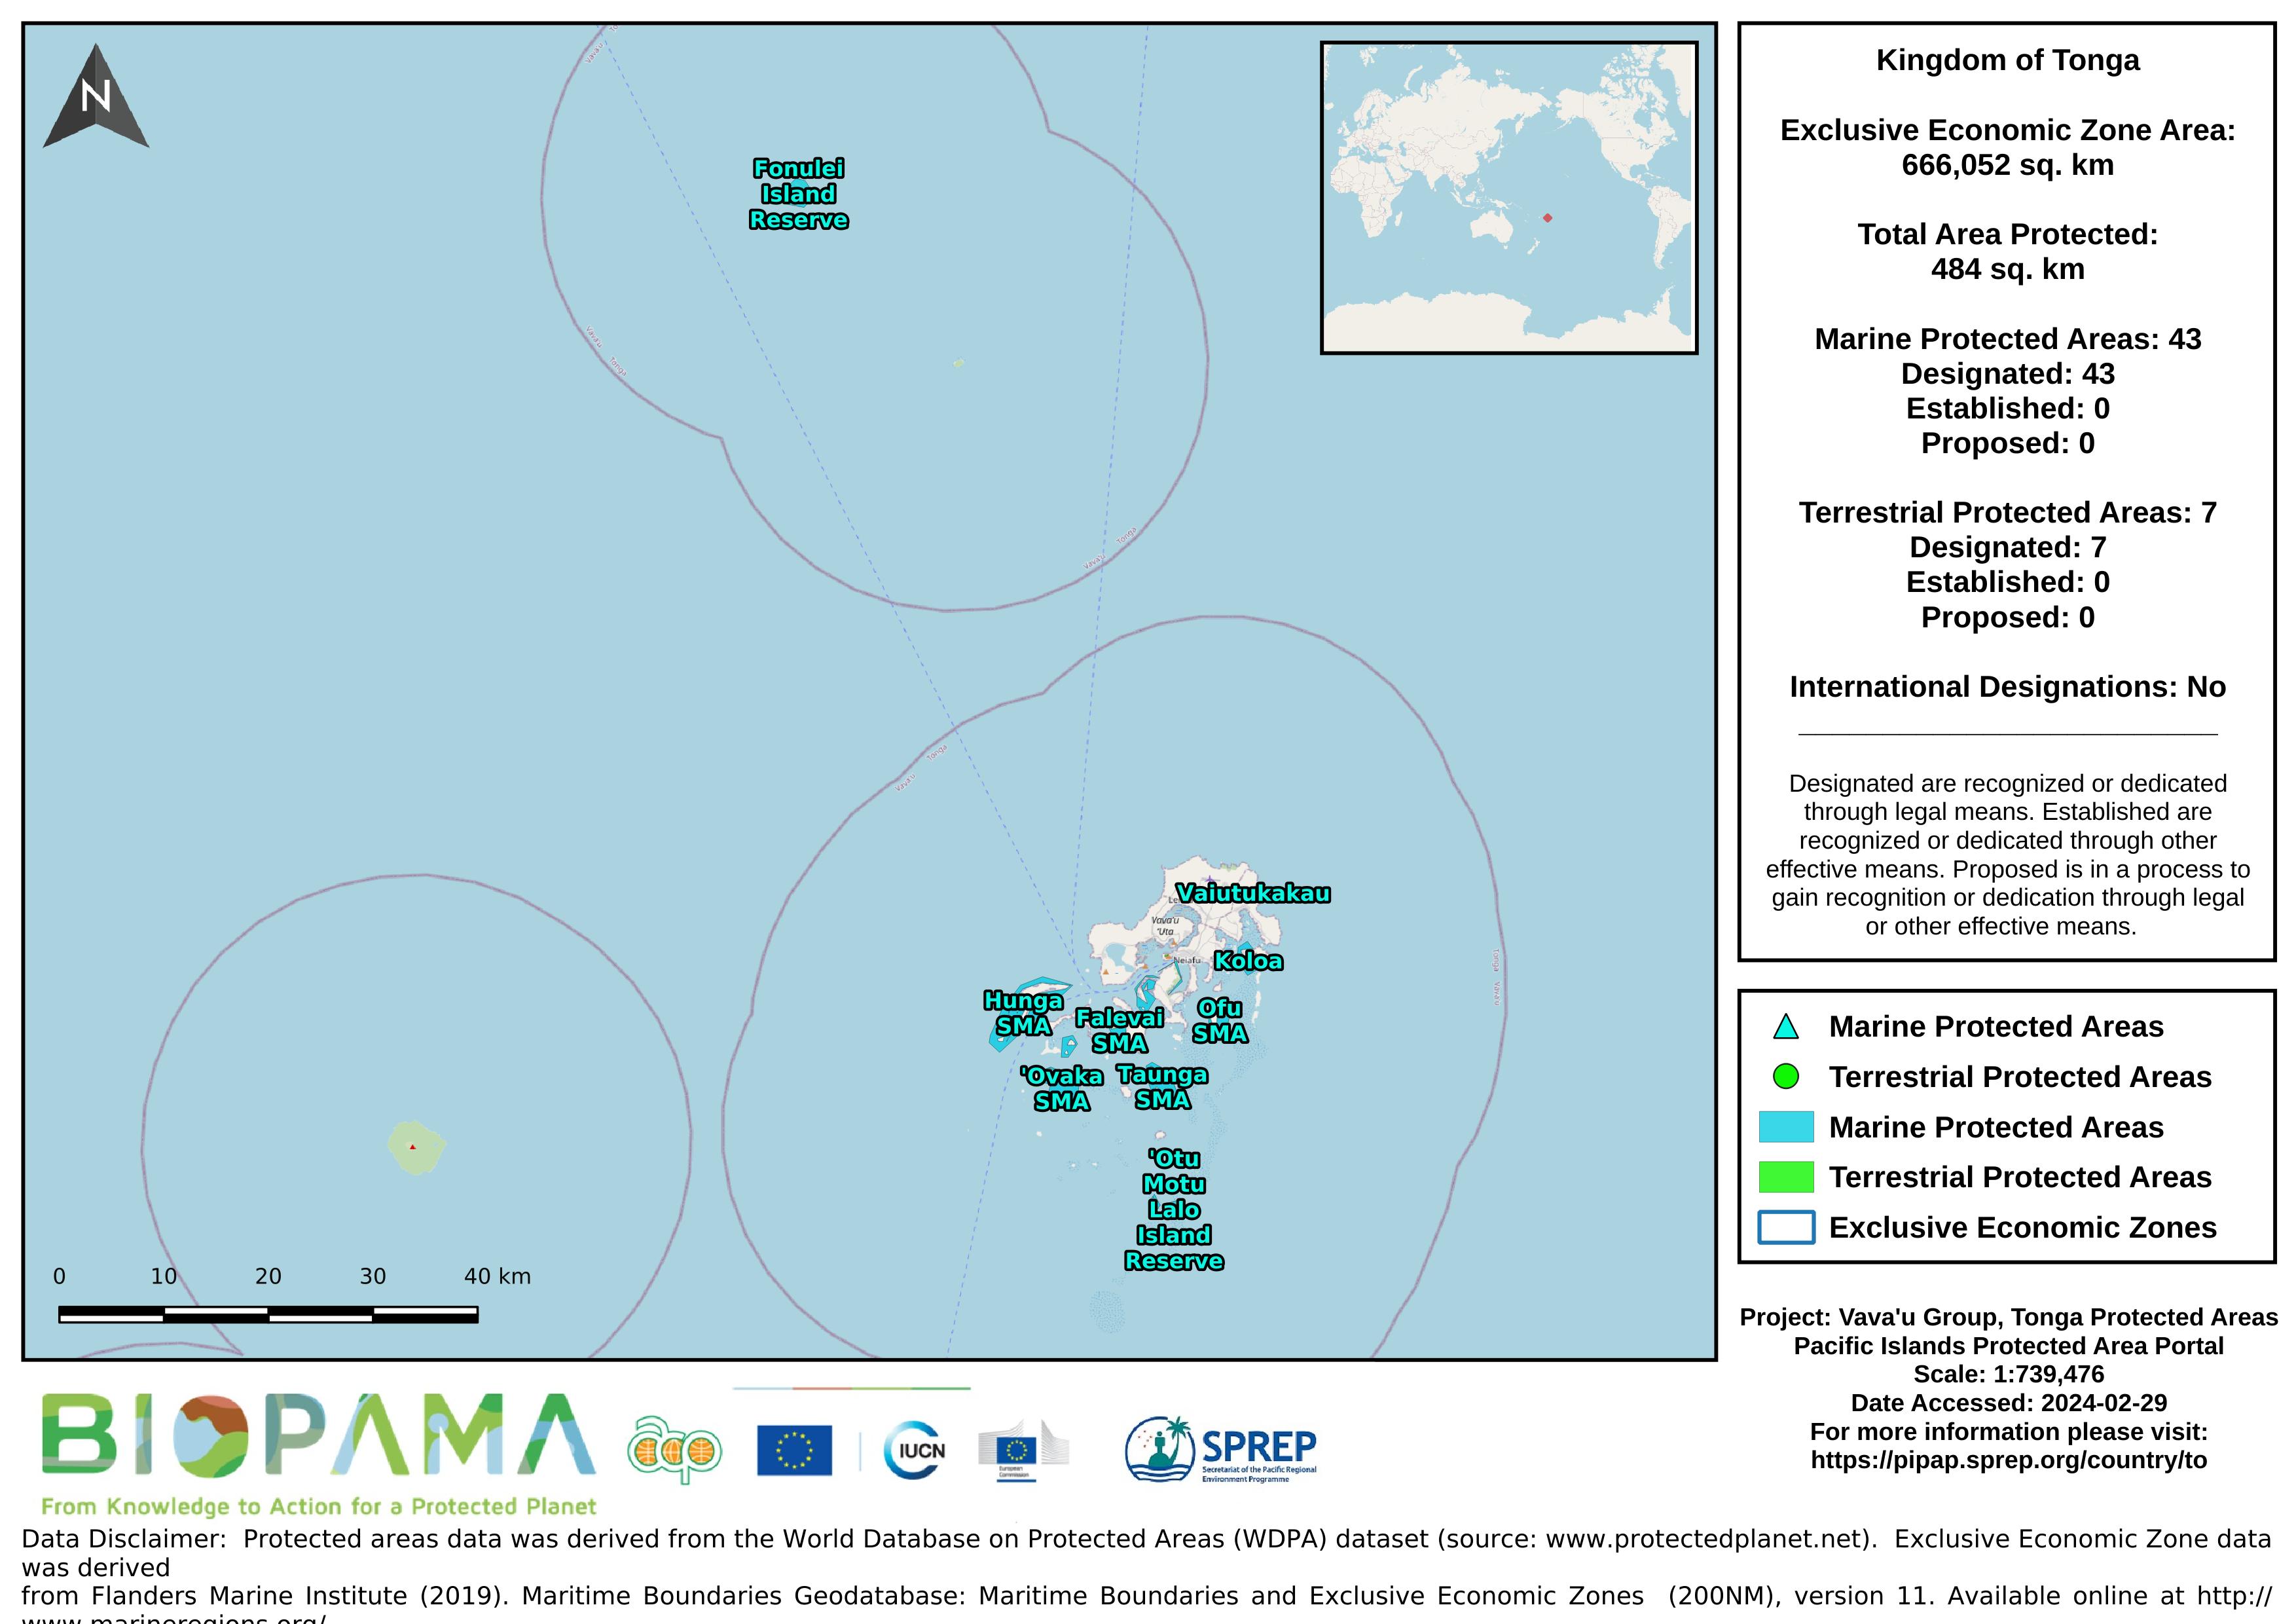
Map of the protected areas for the Vava'u Group, Tonga with country-level summary statistics on the amount of area under protection, count for each type of protected area (terrestrial or marine), and the count of their designation.
The Institute for Marine Remote Sensing (IMaRS) at the University of South Florida (USF) was funded by the Oceanography Program of the National Aeronautics and Space Administration (NASA) to provide an exhaustive worldwide inventory of coral reefs using high-resolution satellite imagery. By using a consistent dataset of high-resolution (30 meter) multispectral Landsat 7 images acquired between 1999 and 2002, USF characterized, mapped and estimated the extent of shallow coral reef ecosystems in the main coral reef provinces (Caribbean-Atlantic, Pacific, Indo-Pacific, Red Sea).
GeoJSON file for earthquake centers over a magnitude of 4.5 for the Pacific Islands Region for years 2000-2004. Data are derived from the ANSS Comprehensive Earthquake Catalog (ComCat). ComCat contains earthquake source parameters (e.g. hypocenters, magnitudes, phase picks and amplitudes) and other products (e.g. moment tensor solutions, macroseismic information, tectonic summaries, maps) produced by contributing seismic networks.
GeoJSON file for earthquake centers over a magnitude of 4.5 for the Pacific Islands Region for years 2005-2009. Data are derived from the ANSS Comprehensive Earthquake Catalog (ComCat). ComCat contains earthquake source parameters (e.g. hypocenters, magnitudes, phase picks and amplitudes) and other products (e.g. moment tensor solutions, macroseismic information, tectonic summaries, maps) produced by contributing seismic networks.
GeoJSON file for earthquake centers over a magnitude of 4.5 for the Pacific Islands Region for years 2010-2014. Data are derived from the ANSS Comprehensive Earthquake Catalog (ComCat). ComCat contains earthquake source parameters (e.g. hypocenters, magnitudes, phase picks and amplitudes) and other products (e.g. moment tensor solutions, macroseismic information, tectonic summaries, maps) produced by contributing seismic networks.
GeoJSON file for earthquake centers over a magnitude of 4.5 for the Pacific Islands Region for years 2015-2019. Data are derived from the ANSS Comprehensive Earthquake Catalog (ComCat). ComCat contains earthquake source parameters (e.g. hypocenters, magnitudes, phase picks and amplitudes) and other products (e.g. moment tensor solutions, macroseismic information, tectonic summaries, maps) produced by contributing seismic networks.
Pacific islands region exclusive economic zones (EEZs)
From the Turtle Research and Monitoring Database System (TREDS)
From the Turtle Research and Monitoring Database System (TREDS)
From the Turtle Research and Monitoring Database System (TREDS)
From the Turtle Research and Monitoring Database System (TREDS)
From the Turtle Research and Monitoring Database System (TREDS)
From the Turtle Research and Monitoring Database System (TREDS)
The SPREP ID map is a high resolution (1MB) that shows SPREP member countries with their Exclusive Economic Zone (EEZ) boundaries developed by the GIS team at SPREP.
The SPREP ID map is low resolution (200KB) that shows SPREP member countries with their Exclusive Economic Zone (EEZ) boundaries developed by the GIS team at SPREP.
The map is high resolution showing SPREP member countries' Exclusive Economic Zone (EEZ) boundaries overlaid on a bathymetric base layer that was developed by the GIS team at SPREP.