raw rainfall data collected in 2016
Tables 14 cross-tabulates different socio-demographic and economic variables by damage (household + other dwelling). The table suggests that the worse-off were more affected by GITA.
*data extracted from the PDNA report*
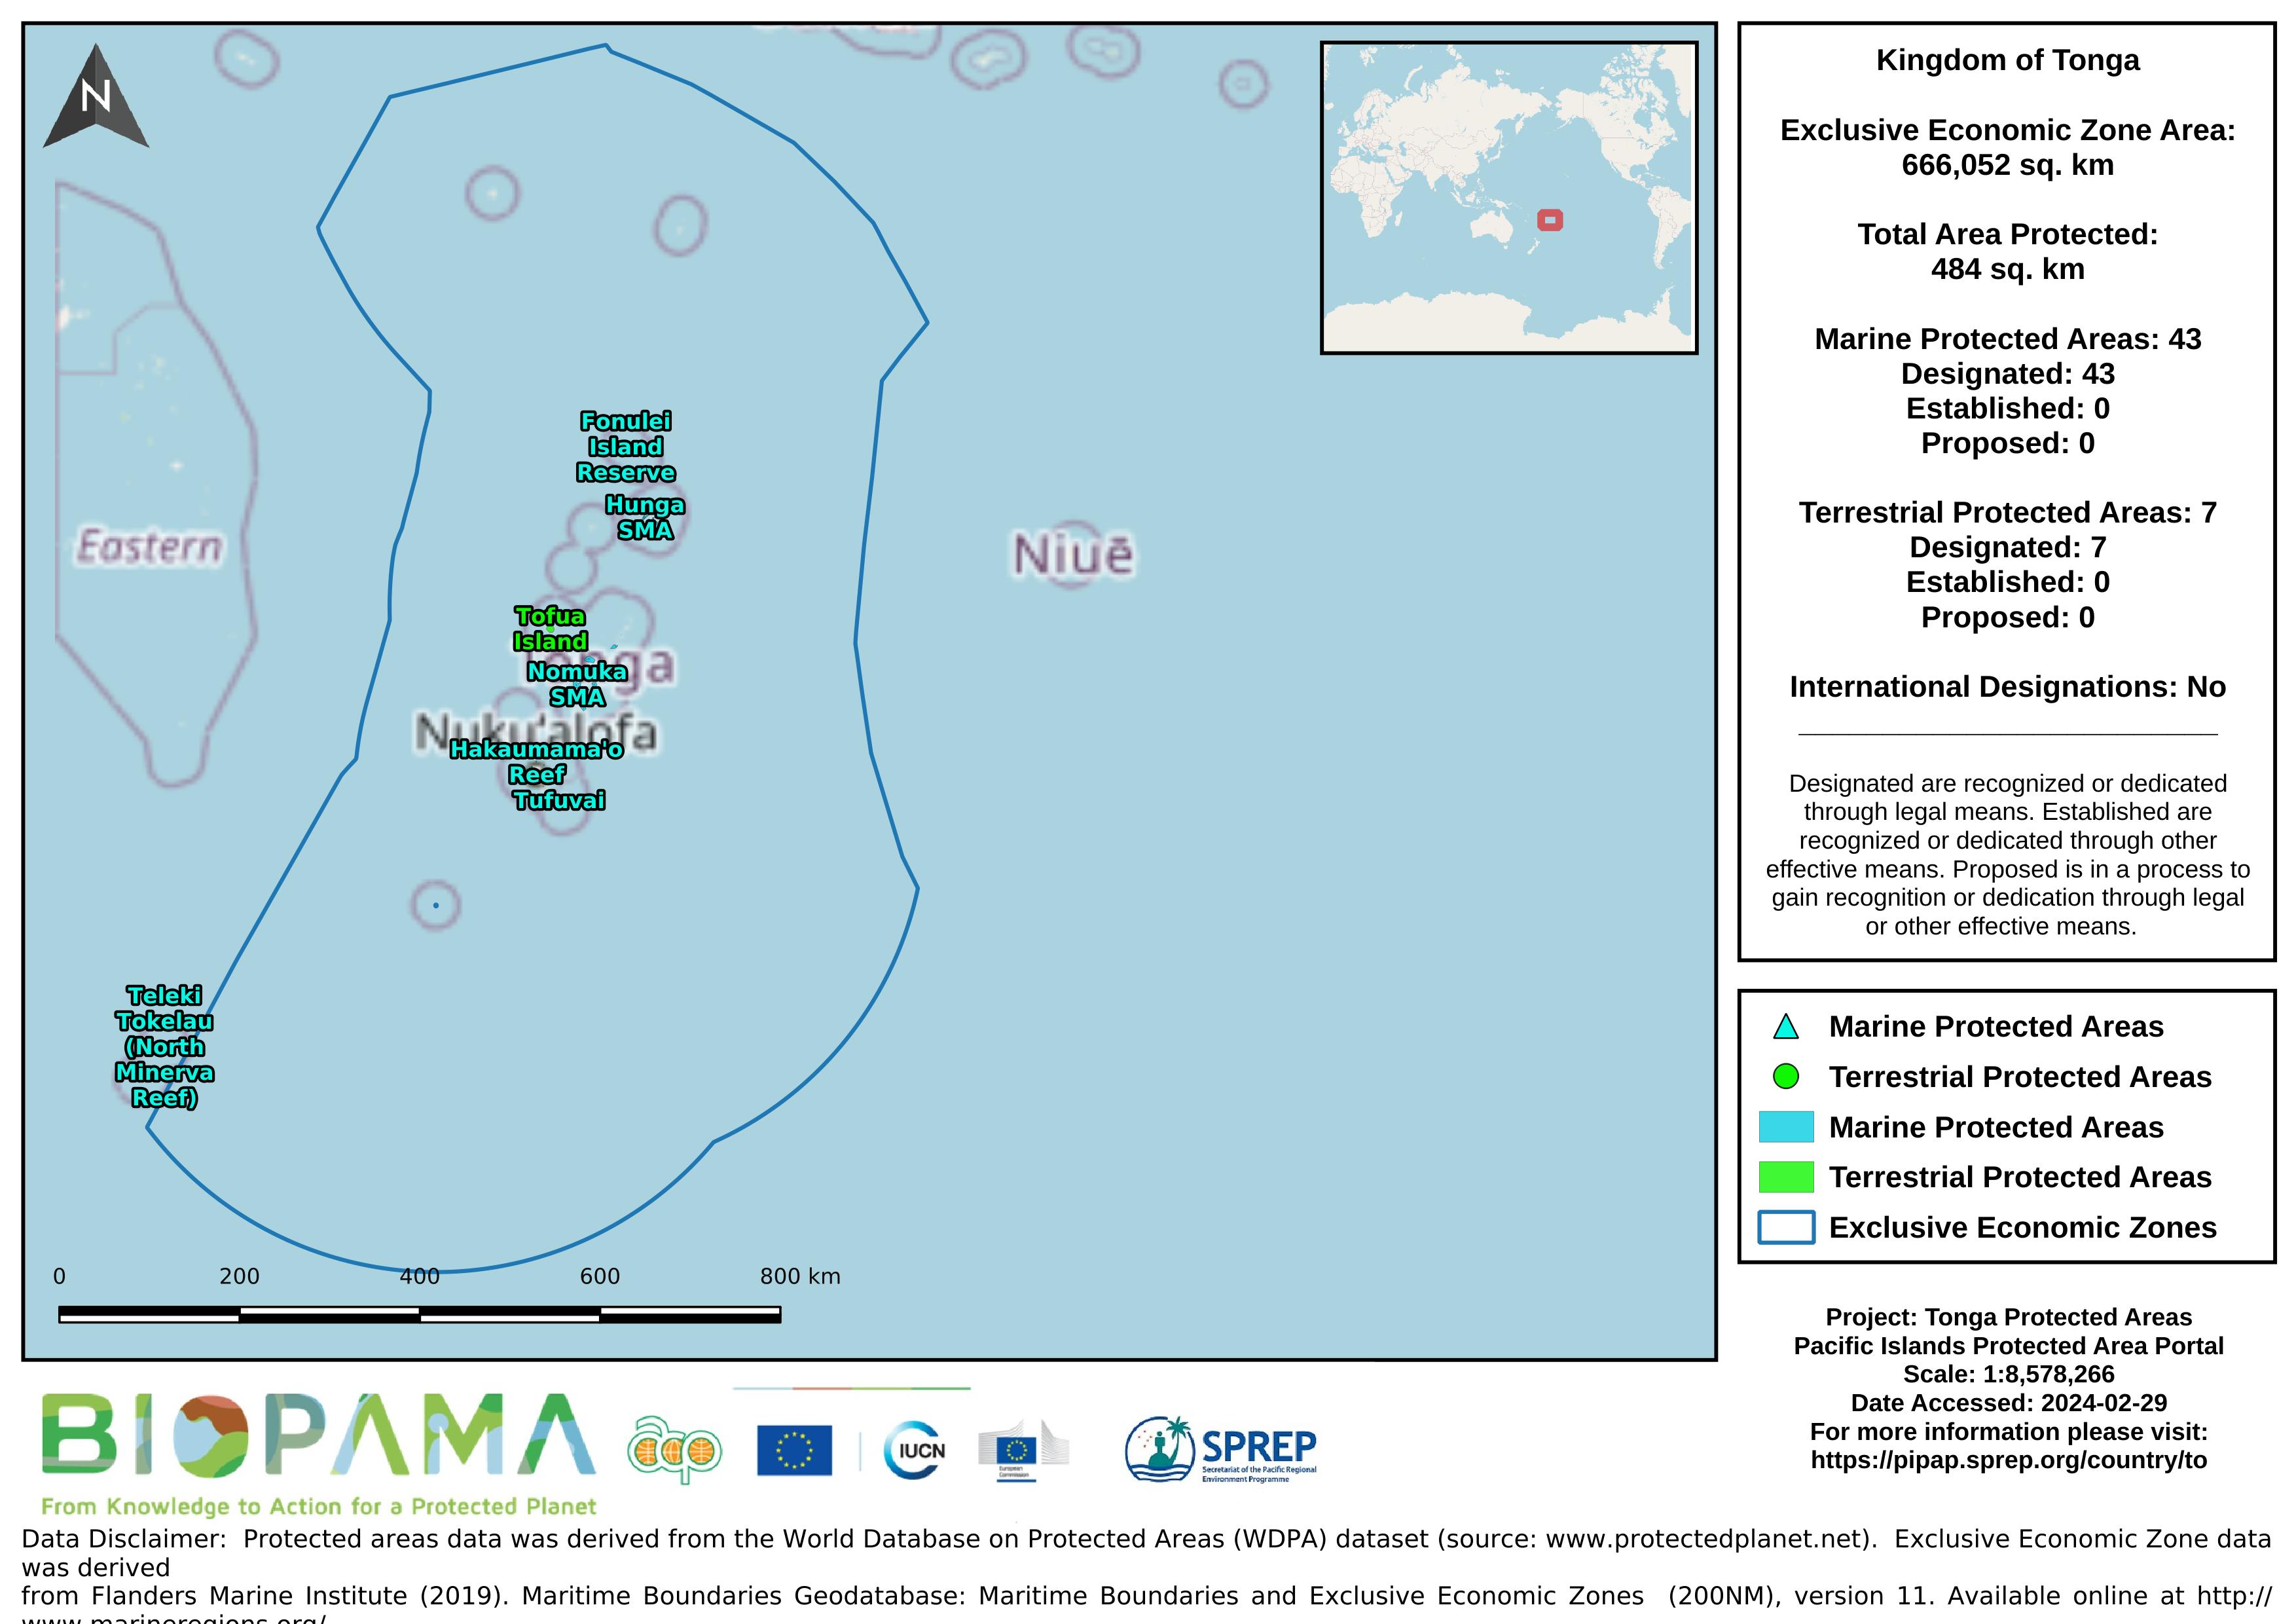
Map of the protected areas for Tonga with country-level summary statistics on the amount of area under protection, count for each type of protected area (terrestrial or marine), and the count of their designation.
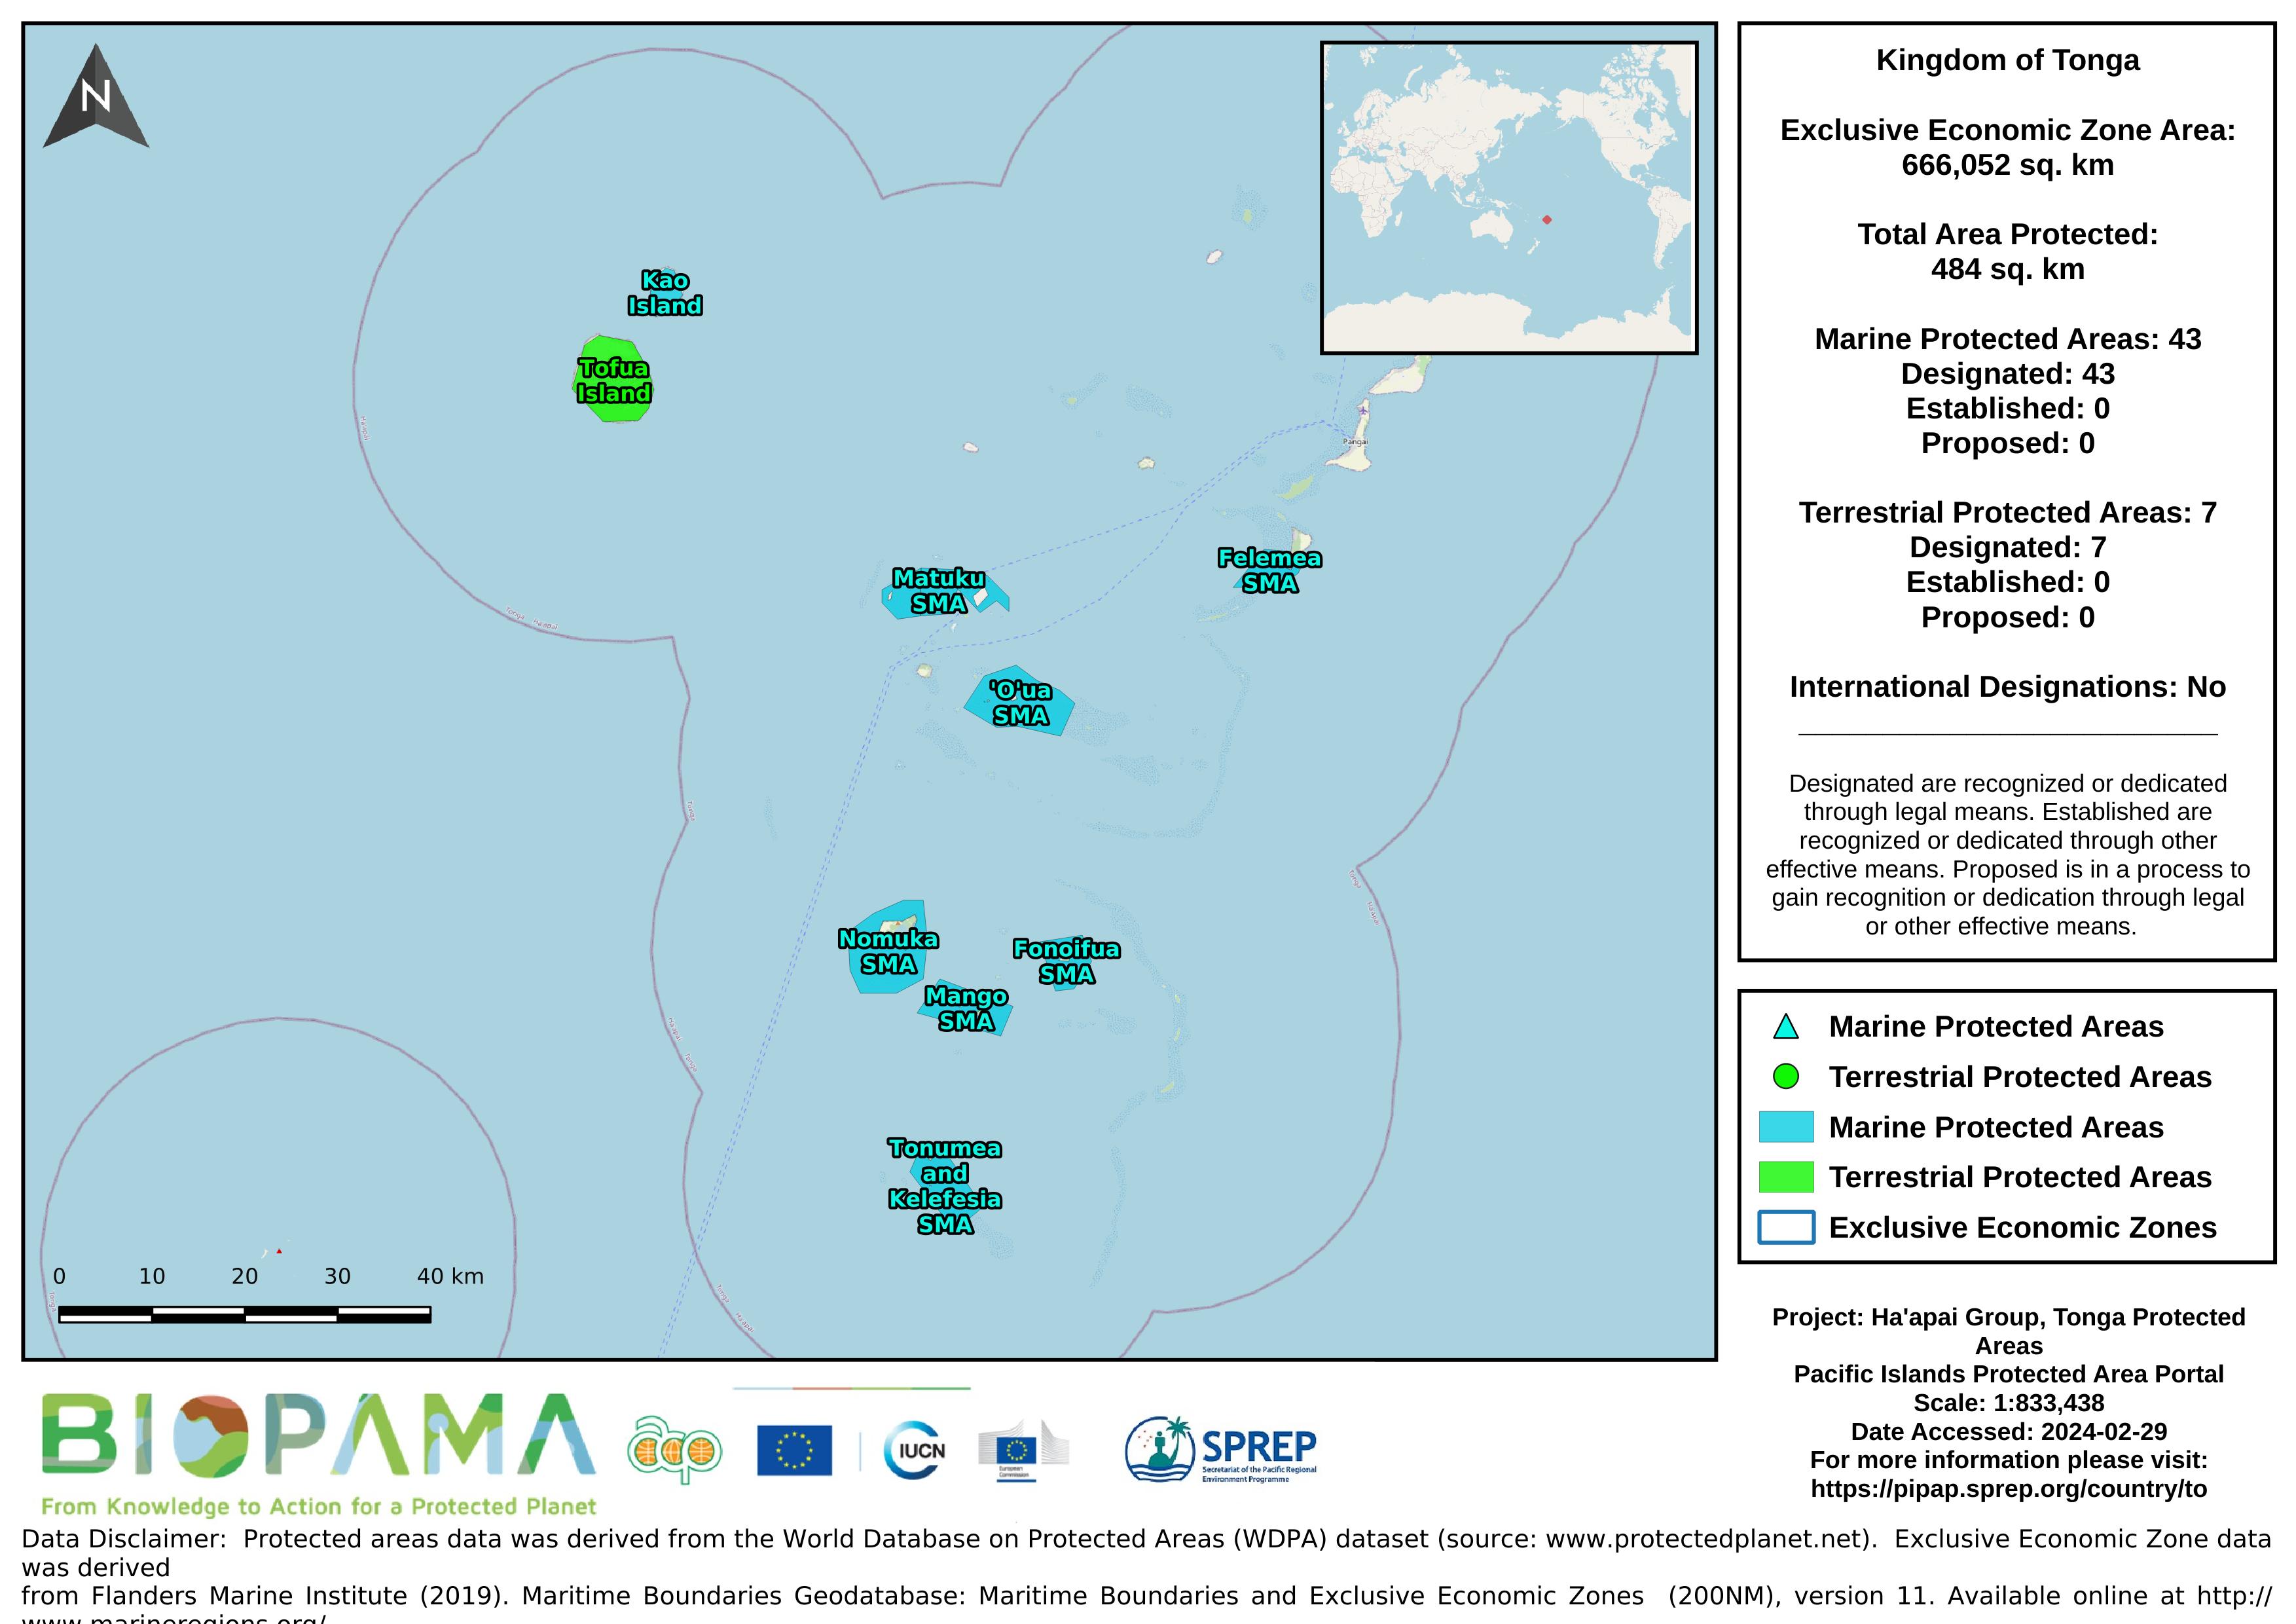
Map of the protected areas for the Ha'apai Group, Tonga with country-level summary statistics on the amount of area under protection, count for each type of protected area (terrestrial or marine), and the count of their designation.
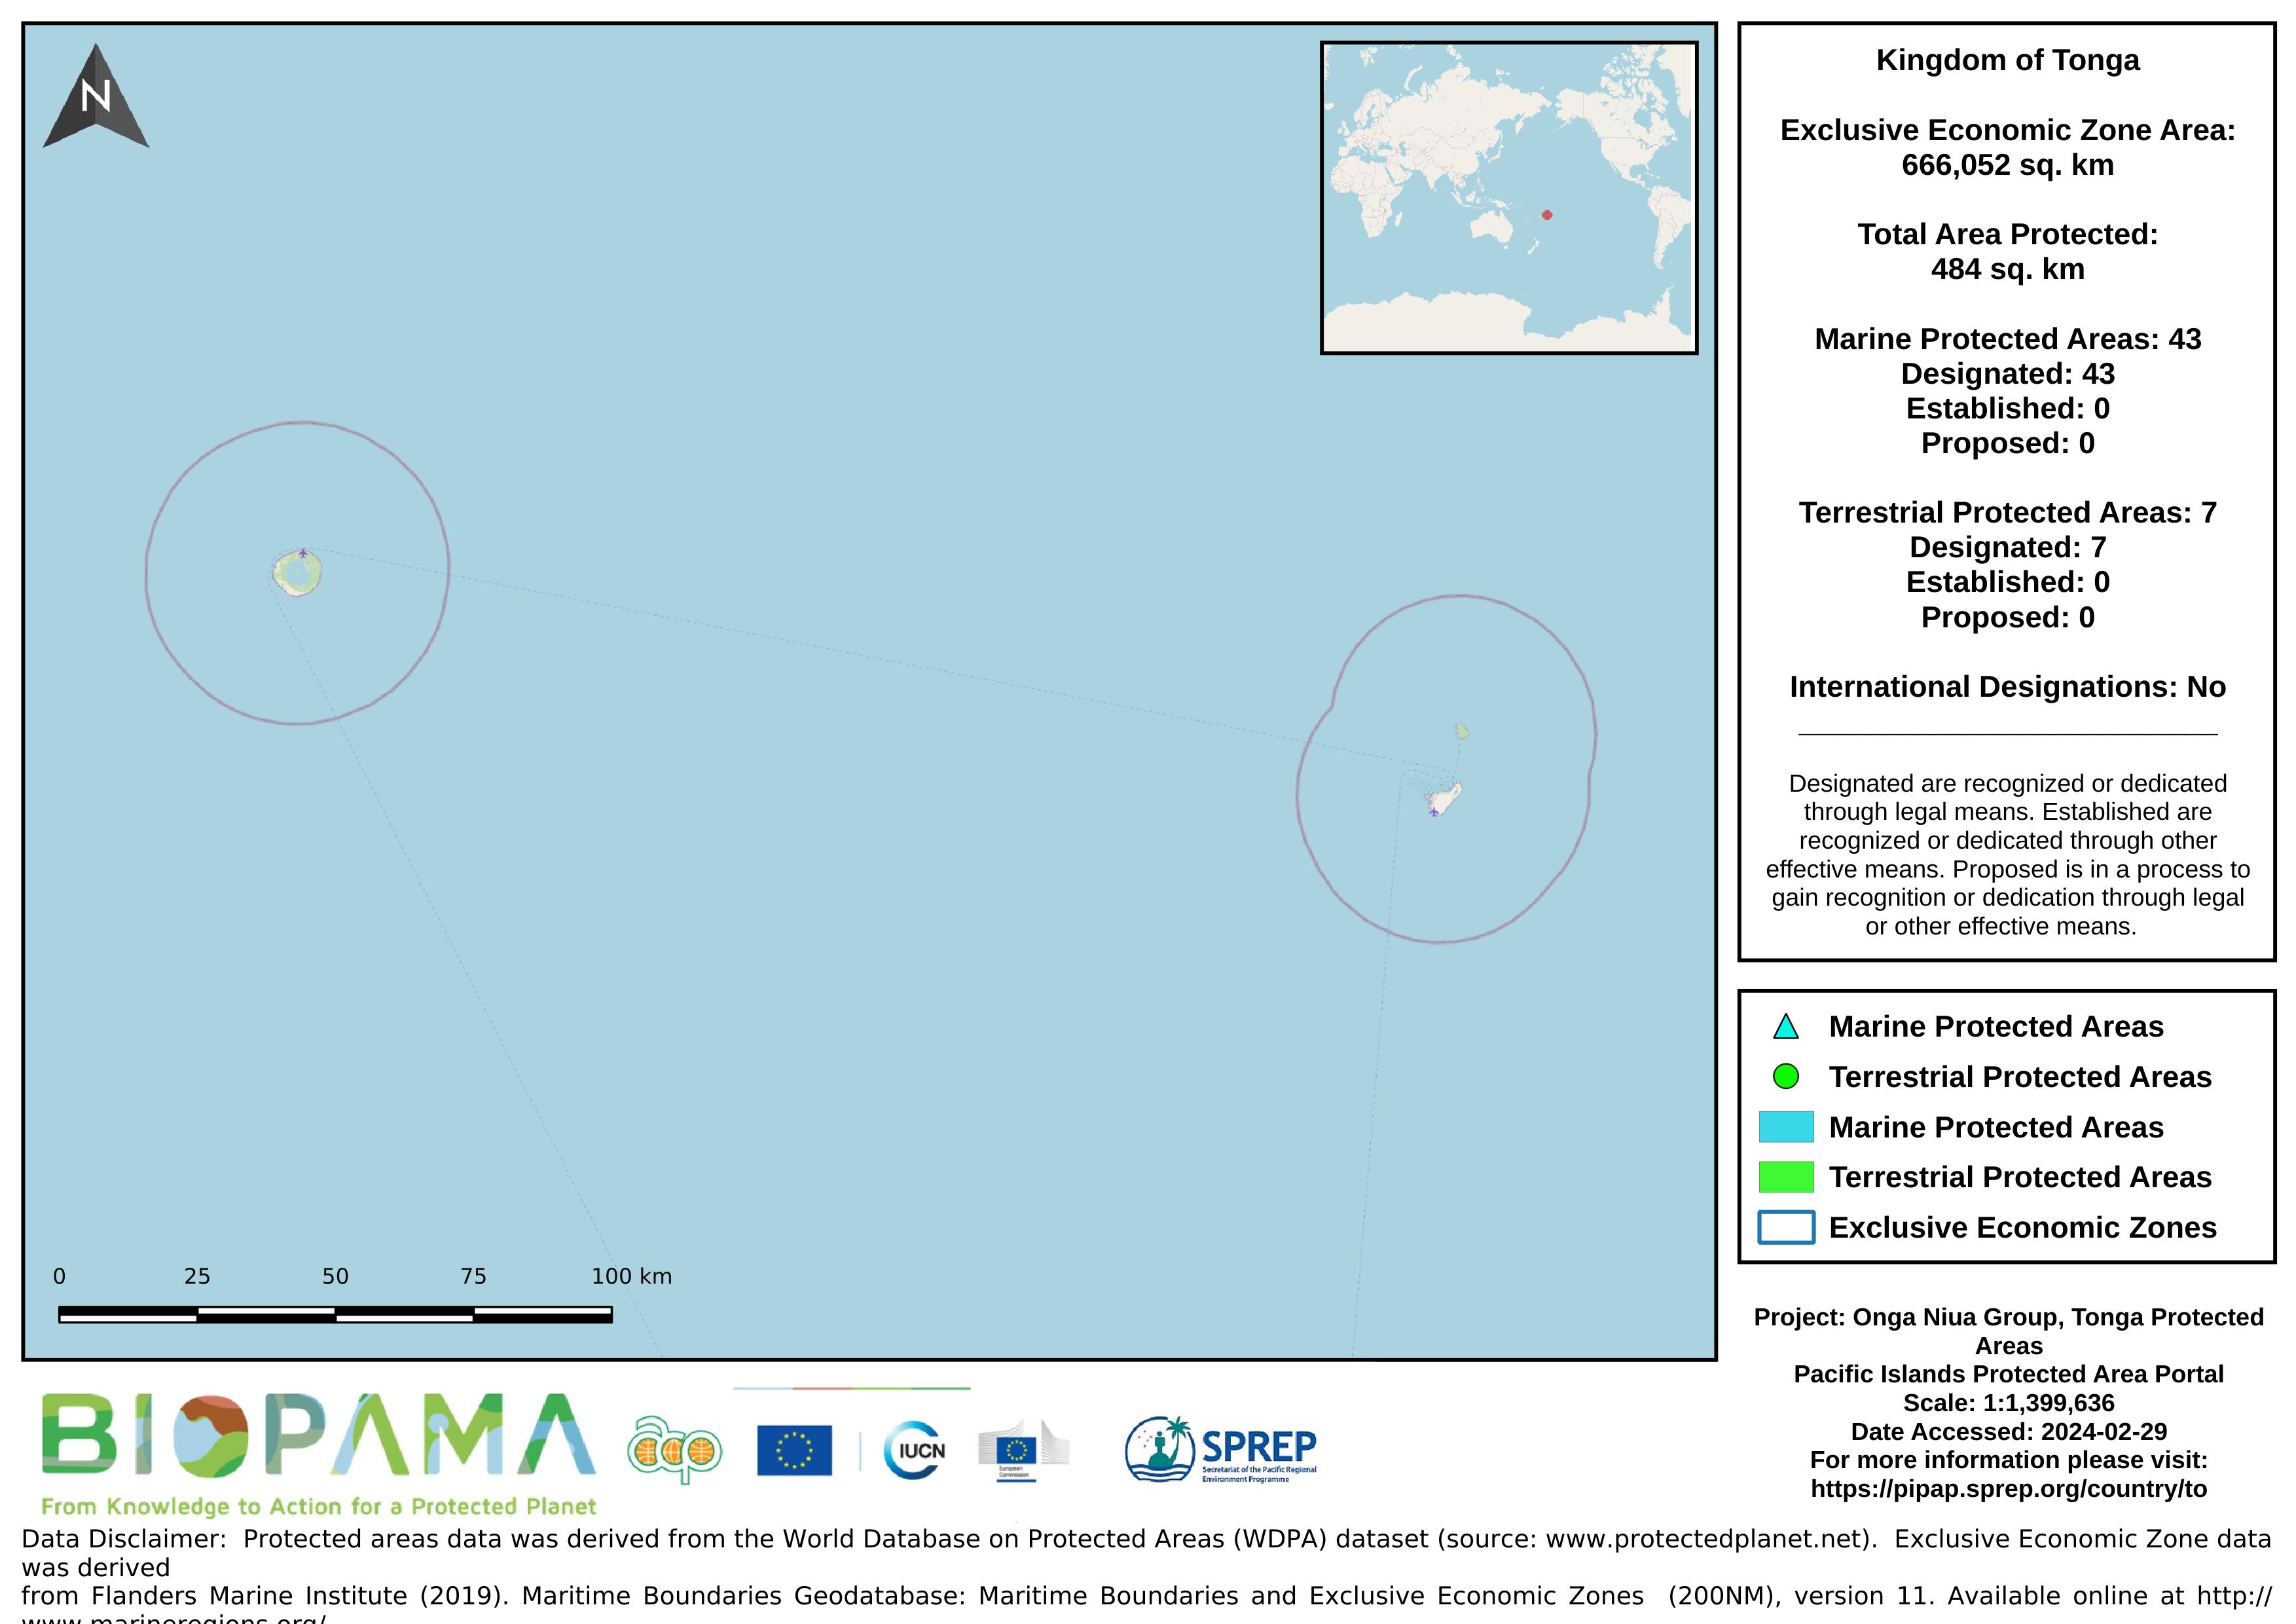
Map of the protected areas for the Niuas Group, Tonga with country-level summary statistics on the amount of area under protection, count for each type of protected area (terrestrial or marine), and the count of their designation.
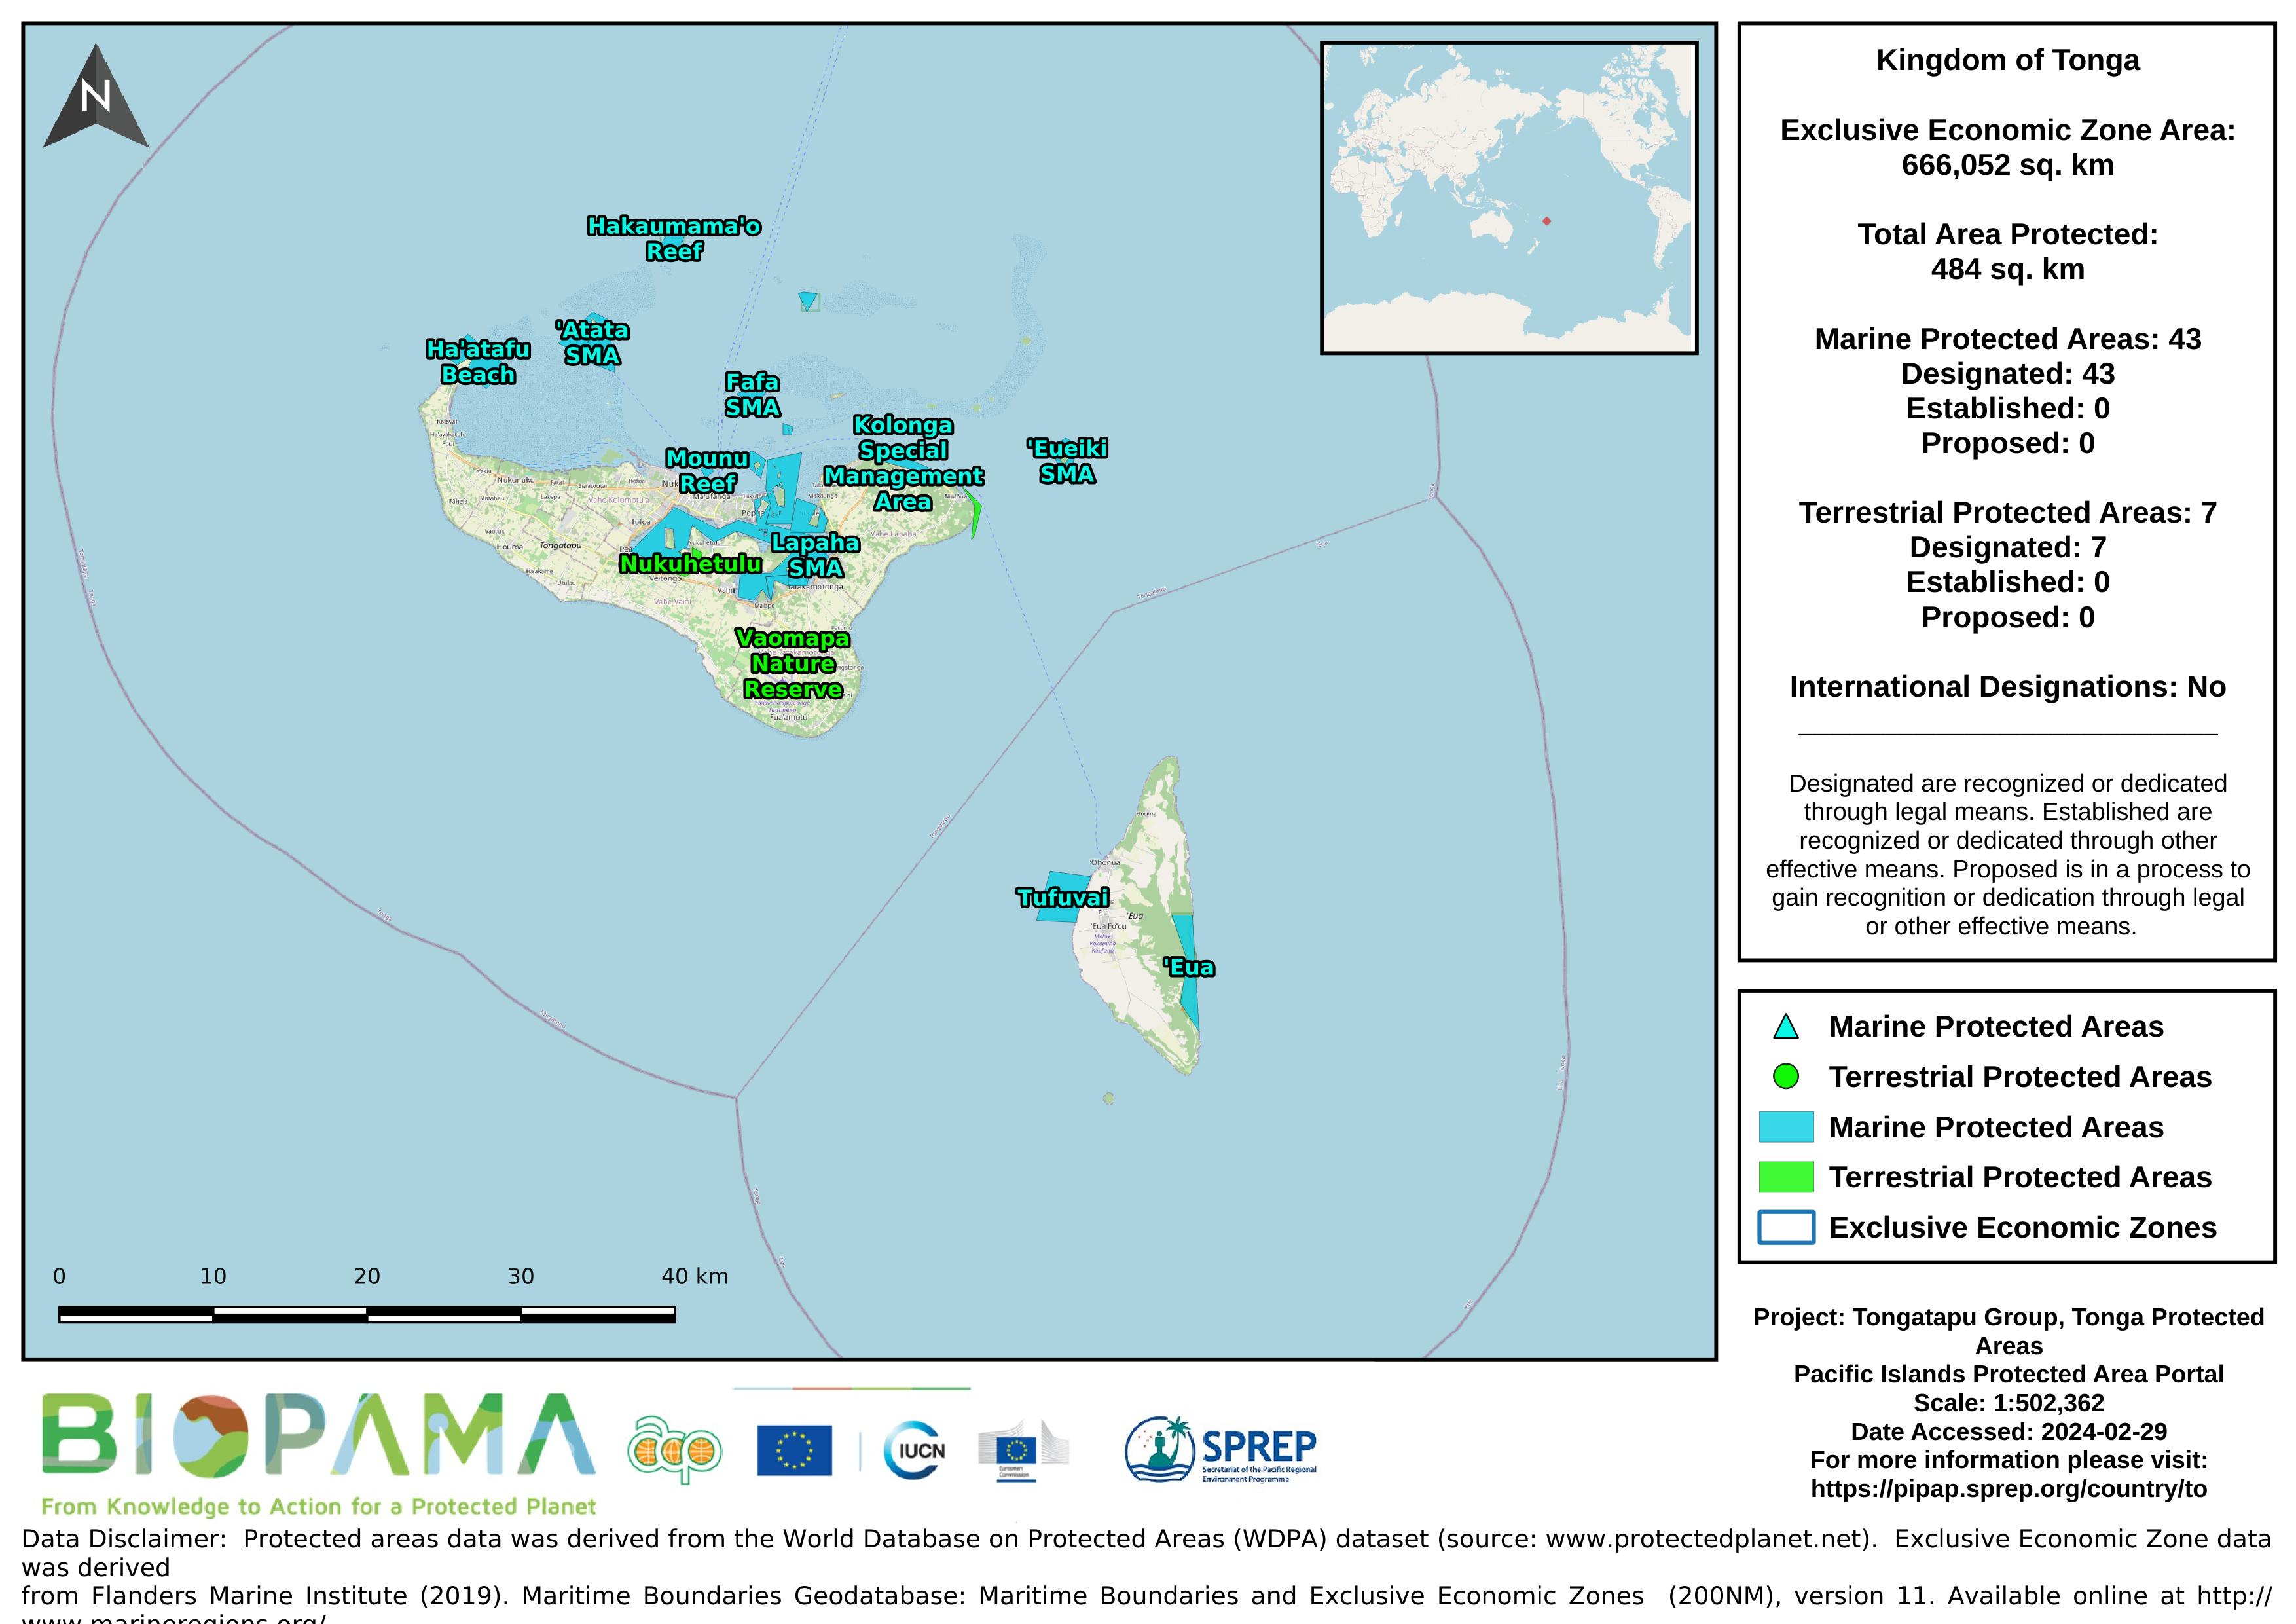
Map of the protected areas for the Tongatapu Group, Tonga with country-level summary statistics on the amount of area under protection, count for each type of protected area (terrestrial or marine), and the count of their designation.
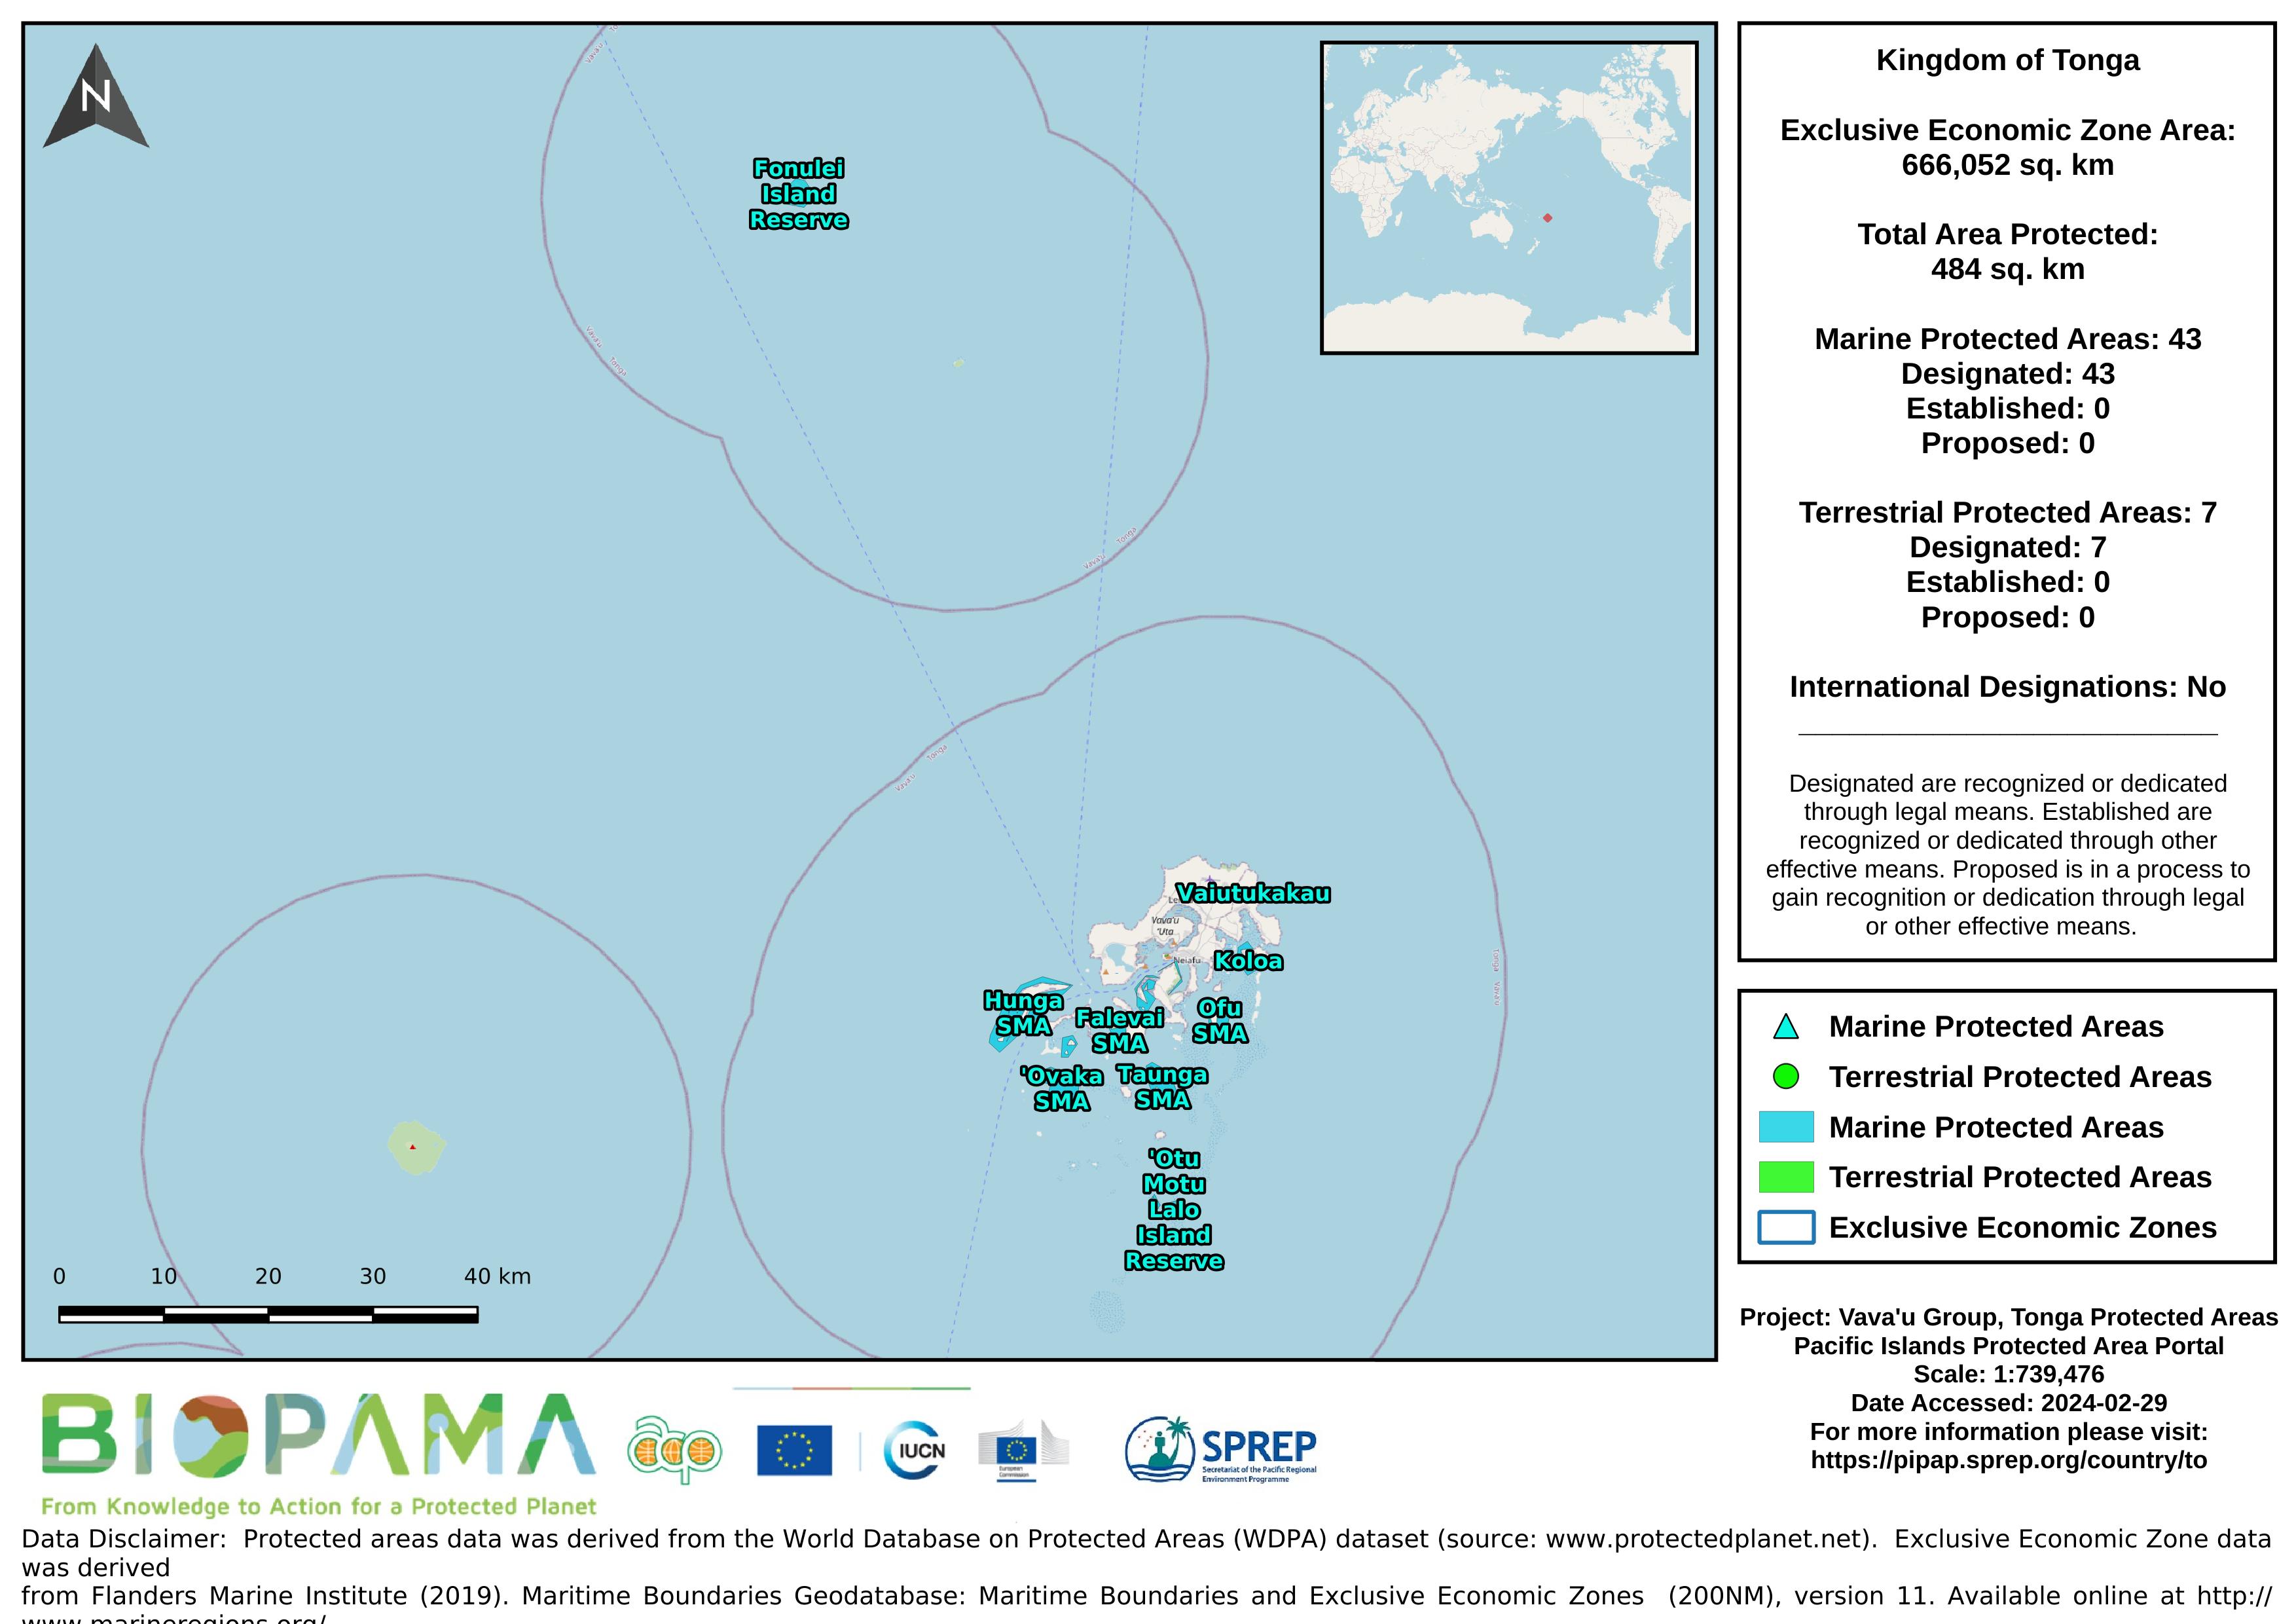
Map of the protected areas for the Vava'u Group, Tonga with country-level summary statistics on the amount of area under protection, count for each type of protected area (terrestrial or marine), and the count of their designation.
The World Database on Protected Areas (WDPA) is the most comprehensive global database of marine and terrestrial protected areas, updated on a monthly basis, and is one of the key global biodiversity data sets being widely used by scientists, businesses, governments, International secretariats and others to inform planning, policy decisions and management.
Spreadsheet and graph derived from table 1 of Kingdom of Tonga National Plan of Action (NPOA) Shark-Plan (2014-216)
Time series data and graph of Tonga's deepwater fishery total catch 2006-2016.
Most atoll ecosystems and a wide range of terrestrial and marine organisms, and genetic or cultivars varieties of
traditional food and other multi-purpose plants are declining in abundance and under threat of either “economic extinction” or extirpation and in need of some form of protection. The severity of the situation is greatest on those more urbanized atolls where both the biodiversity and the local knowledge of biodiversity are threatened.
*see R Thanman pdf report for more information*
Terrestrial and marine plants and animals that are rare, endangered or in short supply,
and in need of protection in the atolls of the Pacific Islands.
This excel file include four spreadsheets each representing a separate theme (EMG = Environmental Monitoring and Governance, IOE = Island and Ocean Ecosystems, CCR = Climate Change Resilience, WMPC = waste). Within each theme are the core national environment indicators (scrolling from left to right).
Bio-ORACLE is a set of GIS rasters providing geophysical, biotic and environmental data for surface and benthic marine realms. The data are available for global-scale applications at a spatial resolution of 5 arcmin (approximately 9.2 km at the equator).
Linking biodiversity occurrence data to the physical and biotic environment provides a framework to formulate hypotheses about the ecological processes governing spatial and temporal patterns in biodiversity, which can be useful for marine ecosystem management and conservation.
Raster data representing the mean levels of calcite in µmol/m3 for the surface water layer. The data are available for global-scale applications at a spatial resolution of 5 arcmin (approximately 9.2 km at the equator).
Marine data layers for present conditions were produced with climate data describing monthly averages for the period 2000–2014, obtained from pre-processed global ocean re-analyses combining satellite and in situ observations at regular two- and three-dimensional spatial grids.
Raster data representing the mean levels of current velocities in meters/second for the surface water layer. The data are available for global-scale applications at a spatial resolution of 5 arcmin (approximately 9.2 km at the equator).
Marine data layers for present conditions were produced with climate data describing monthly averages for the period 2000–2014, obtained from pre-processed global ocean re-analyses combining satellite and in situ observations at regular two- and three-dimensional spatial grids.