Raster data representing the mean levels of nitrate in µmol/m3 for the surface water layer. The data are available for global-scale applications at a spatial resolution of 5 arcmin (approximately 9.2 km at the equator).
Marine data layers for present conditions were produced with climate data describing monthly averages for the period 2000–2014, obtained from pre-processed global ocean re-analyses combining satellite and in situ observations at regular two- and three-dimensional spatial grids.
Raster data representing the mean levels of phosphate in µmol/m3 for the surface water layer. The data are available for global-scale applications at a spatial resolution of 5 arcmin (approximately 9.2 km at the equator).
Marine data layers for present conditions were produced with climate data describing monthly averages for the period 2000–2014, obtained from pre-processed global ocean re-analyses combining satellite and in situ observations at regular two- and three-dimensional spatial grids.
Raster data representing the mean levels of phytoplankton in µmol/m3 for the surface water layer. The data are available for global-scale applications at a spatial resolution of 5 arcmin (approximately 9.2 km at the equator).
Marine data layers for present conditions were produced with climate data describing monthly averages for the period 2000–2014, obtained from pre-processed global ocean re-analyses combining satellite and in situ observations at regular two- and three-dimensional spatial grids.
Raster data representing the mean levels of salinity in practical salinity scale (PSS) for the surface water layer. The data are available for global-scale applications at a spatial resolution of 5 arcmin (approximately 9.2 km at the equator).
Marine data layers for present conditions were produced with climate data describing monthly averages for the period 2000–2014, obtained from pre-processed global ocean re-analyses combining satellite and in situ observations at regular two- and three-dimensional spatial grids.
Raster data representing the mean levels of silicate in µmol/m3 for the surface water layer. The data are available for global-scale applications at a spatial resolution of 5 arcmin (approximately 9.2 km at the equator).
Marine data layers for present conditions were produced with climate data describing monthly averages for the period 2000–2014, obtained from pre-processed global ocean re-analyses combining satellite and in situ observations at regular two- and three-dimensional spatial grids.
Raster data representing the mean levels of temperature in degrees Celsius (°C) for the surface water layer. The data are available for global-scale applications at a spatial resolution of 5 arcmin (approximately 9.2 km at the equator).
Marine data layers for present conditions were produced with climate data describing monthly averages for the period 2000–2014, obtained from pre-processed global ocean re-analyses combining satellite and in situ observations at regular two- and three-dimensional spatial grids.
The Gridded Population of the World, Version 4 (GPWv4): Population Density, Revision 11 consists of estimates of human population density (number of persons per square kilometer) based on counts consistent with national censuses and population registers, for the years 2000. A proportional allocation gridding algorithm, utilizing approximately 13.5 million national and sub-national administrative units, was used to assign population counts to 30 arc-second grid cells.
The Gridded Population of the World, Version 4 (GPWv4): Population Density, Revision 11 consists of estimates of human population density (number of persons per square kilometer) based on counts consistent with national censuses and population registers, for the year 2005. A proportional allocation gridding algorithm, utilizing approximately 13.5 million national and sub-national administrative units, was used to assign population counts to 30 arc-second grid cells.
The Gridded Population of the World, Version 4 (GPWv4): Population Density, Revision 11 consists of estimates of human population density (number of persons per square kilometer) based on counts consistent with national censuses and population registers, for the year 2010. A proportional allocation gridding algorithm, utilizing approximately 13.5 million national and sub-national administrative units, was used to assign population counts to 30 arc-second grid cells.
The Gridded Population of the World, Version 4 (GPWv4): Population Density, Revision 11 consists of estimates of human population density (number of persons per square kilometer) based on counts consistent with national censuses and population registers, for the year 2015. A proportional allocation gridding algorithm, utilizing approximately 13.5 million national and sub-national administrative units, was used to assign population counts to 30 arc-second grid cells.
The Gridded Population of the World, Version 4 (GPWv4): Population Density, Revision 11 consists of estimates of human population density (number of persons per square kilometer) based on counts consistent with national censuses and population registers, for the year 2020. A proportional allocation gridding algorithm, utilizing approximately 13.5 million national and sub-national administrative units, was used to assign population counts to 30 arc-second grid cells.
The increased demand for high quality products in export markets, coupled with Pacific Island Countries (PICs) national desire to protect the environment, biodiversity and family farming structures, lead to assume that organic agriculture could offer good prospects for PICs development. Besides market opportunities, organic agriculture could increase PICs food self-reliance and thus, contribute to reducing the alarming trend of dependency on food imports, as well as improving nutrition.
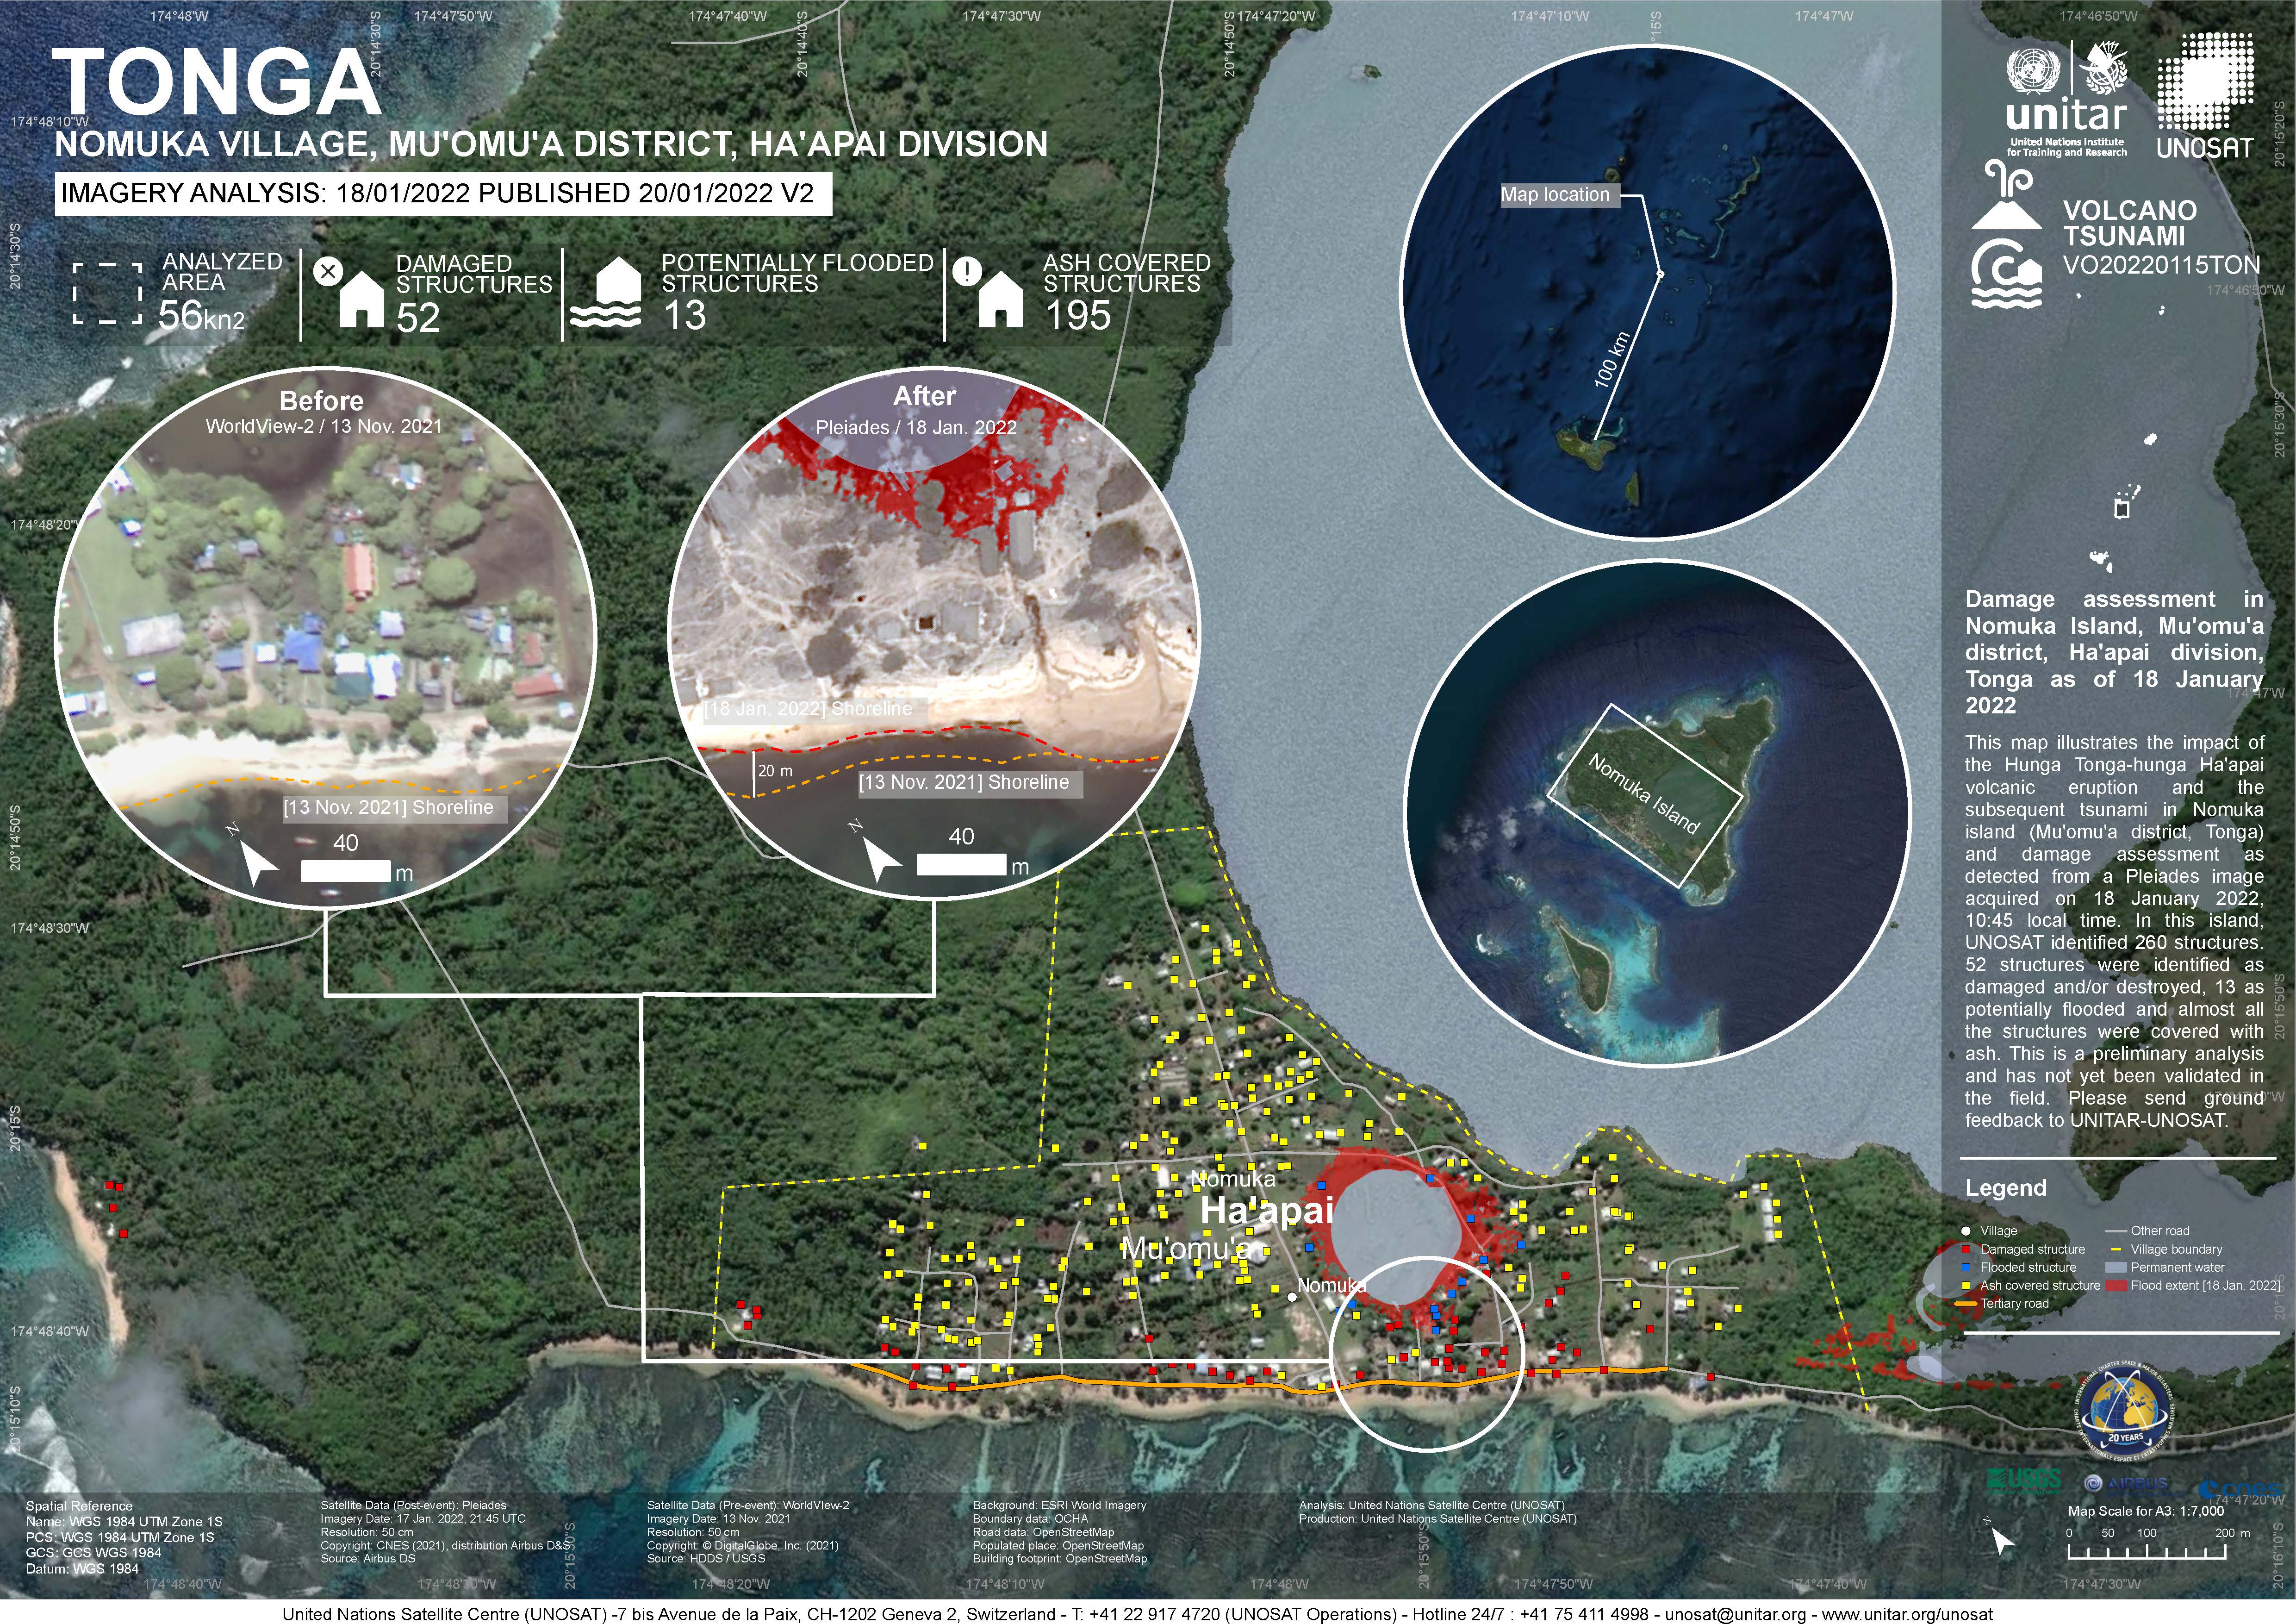
Damage assessment as detected from a Pleiades image acquired on 18 January 2022 in Nomuka Island (Mu'omu'a district, Tonga).
260 structures identified, 52 structures were identified as damaged and/or destroyed, 13 as potentially flooded and almost all structures were covered with ash. This is a preliminary analysis and has not yet been validated in the field
Bio-ORACLE is a set of GIS rasters providing geophysical, biotic and environmental data for surface and benthic marine realms. The data are available for global-scale applications at a spatial resolution of 5 arcmin (approximately 9.2 km at the equator).
Linking biodiversity occurrence data to the physical and biotic environment provides a framework to formulate hypotheses about the ecological processes governing spatial and temporal patterns in biodiversity, which can be useful for marine ecosystem management and conservation.
Reefs at Risk Revisited is a high-resolution update of the original global analysis, Reefs at Risk: A Map-Based Indicator of Threats to the World’s Coral Reefs. Reefs at Risk Revisited uses a global map of coral reefs at 500-m resolution, which is 64 times more detailed than the 4-km resolution map used in the 1998 analysis, and benefits from improvements in many global data sets used to evaluate threats to reefs (most threat data are at 1 km resolution, which is 16 times more detailed than those used in the 1998 analysis).
The USGS Earthquake Hazards Program of the U.S. Geological Survey (USGS) is part of the National Earthquake Hazards Reduction Program (NEHRP) led by the National Institute of Standards and Technology (NIST).
GeoJSON file for earthquake centers over a magnitude of 4.5 for the Pacific Islands Region for years 2000-2004. Data are derived from the ANSS Comprehensive Earthquake Catalog (ComCat). ComCat contains earthquake source parameters (e.g. hypocenters, magnitudes, phase picks and amplitudes) and other products (e.g. moment tensor solutions, macroseismic information, tectonic summaries, maps) produced by contributing seismic networks.
GeoJSON file for earthquake centers over a magnitude of 4.5 for the Pacific Islands Region for years 2005-2009. Data are derived from the ANSS Comprehensive Earthquake Catalog (ComCat). ComCat contains earthquake source parameters (e.g. hypocenters, magnitudes, phase picks and amplitudes) and other products (e.g. moment tensor solutions, macroseismic information, tectonic summaries, maps) produced by contributing seismic networks.