Tables 14 cross-tabulates different socio-demographic and economic variables by damage (household + other dwelling). The table suggests that the worse-off were more affected by GITA.
*data extracted from the PDNA report*
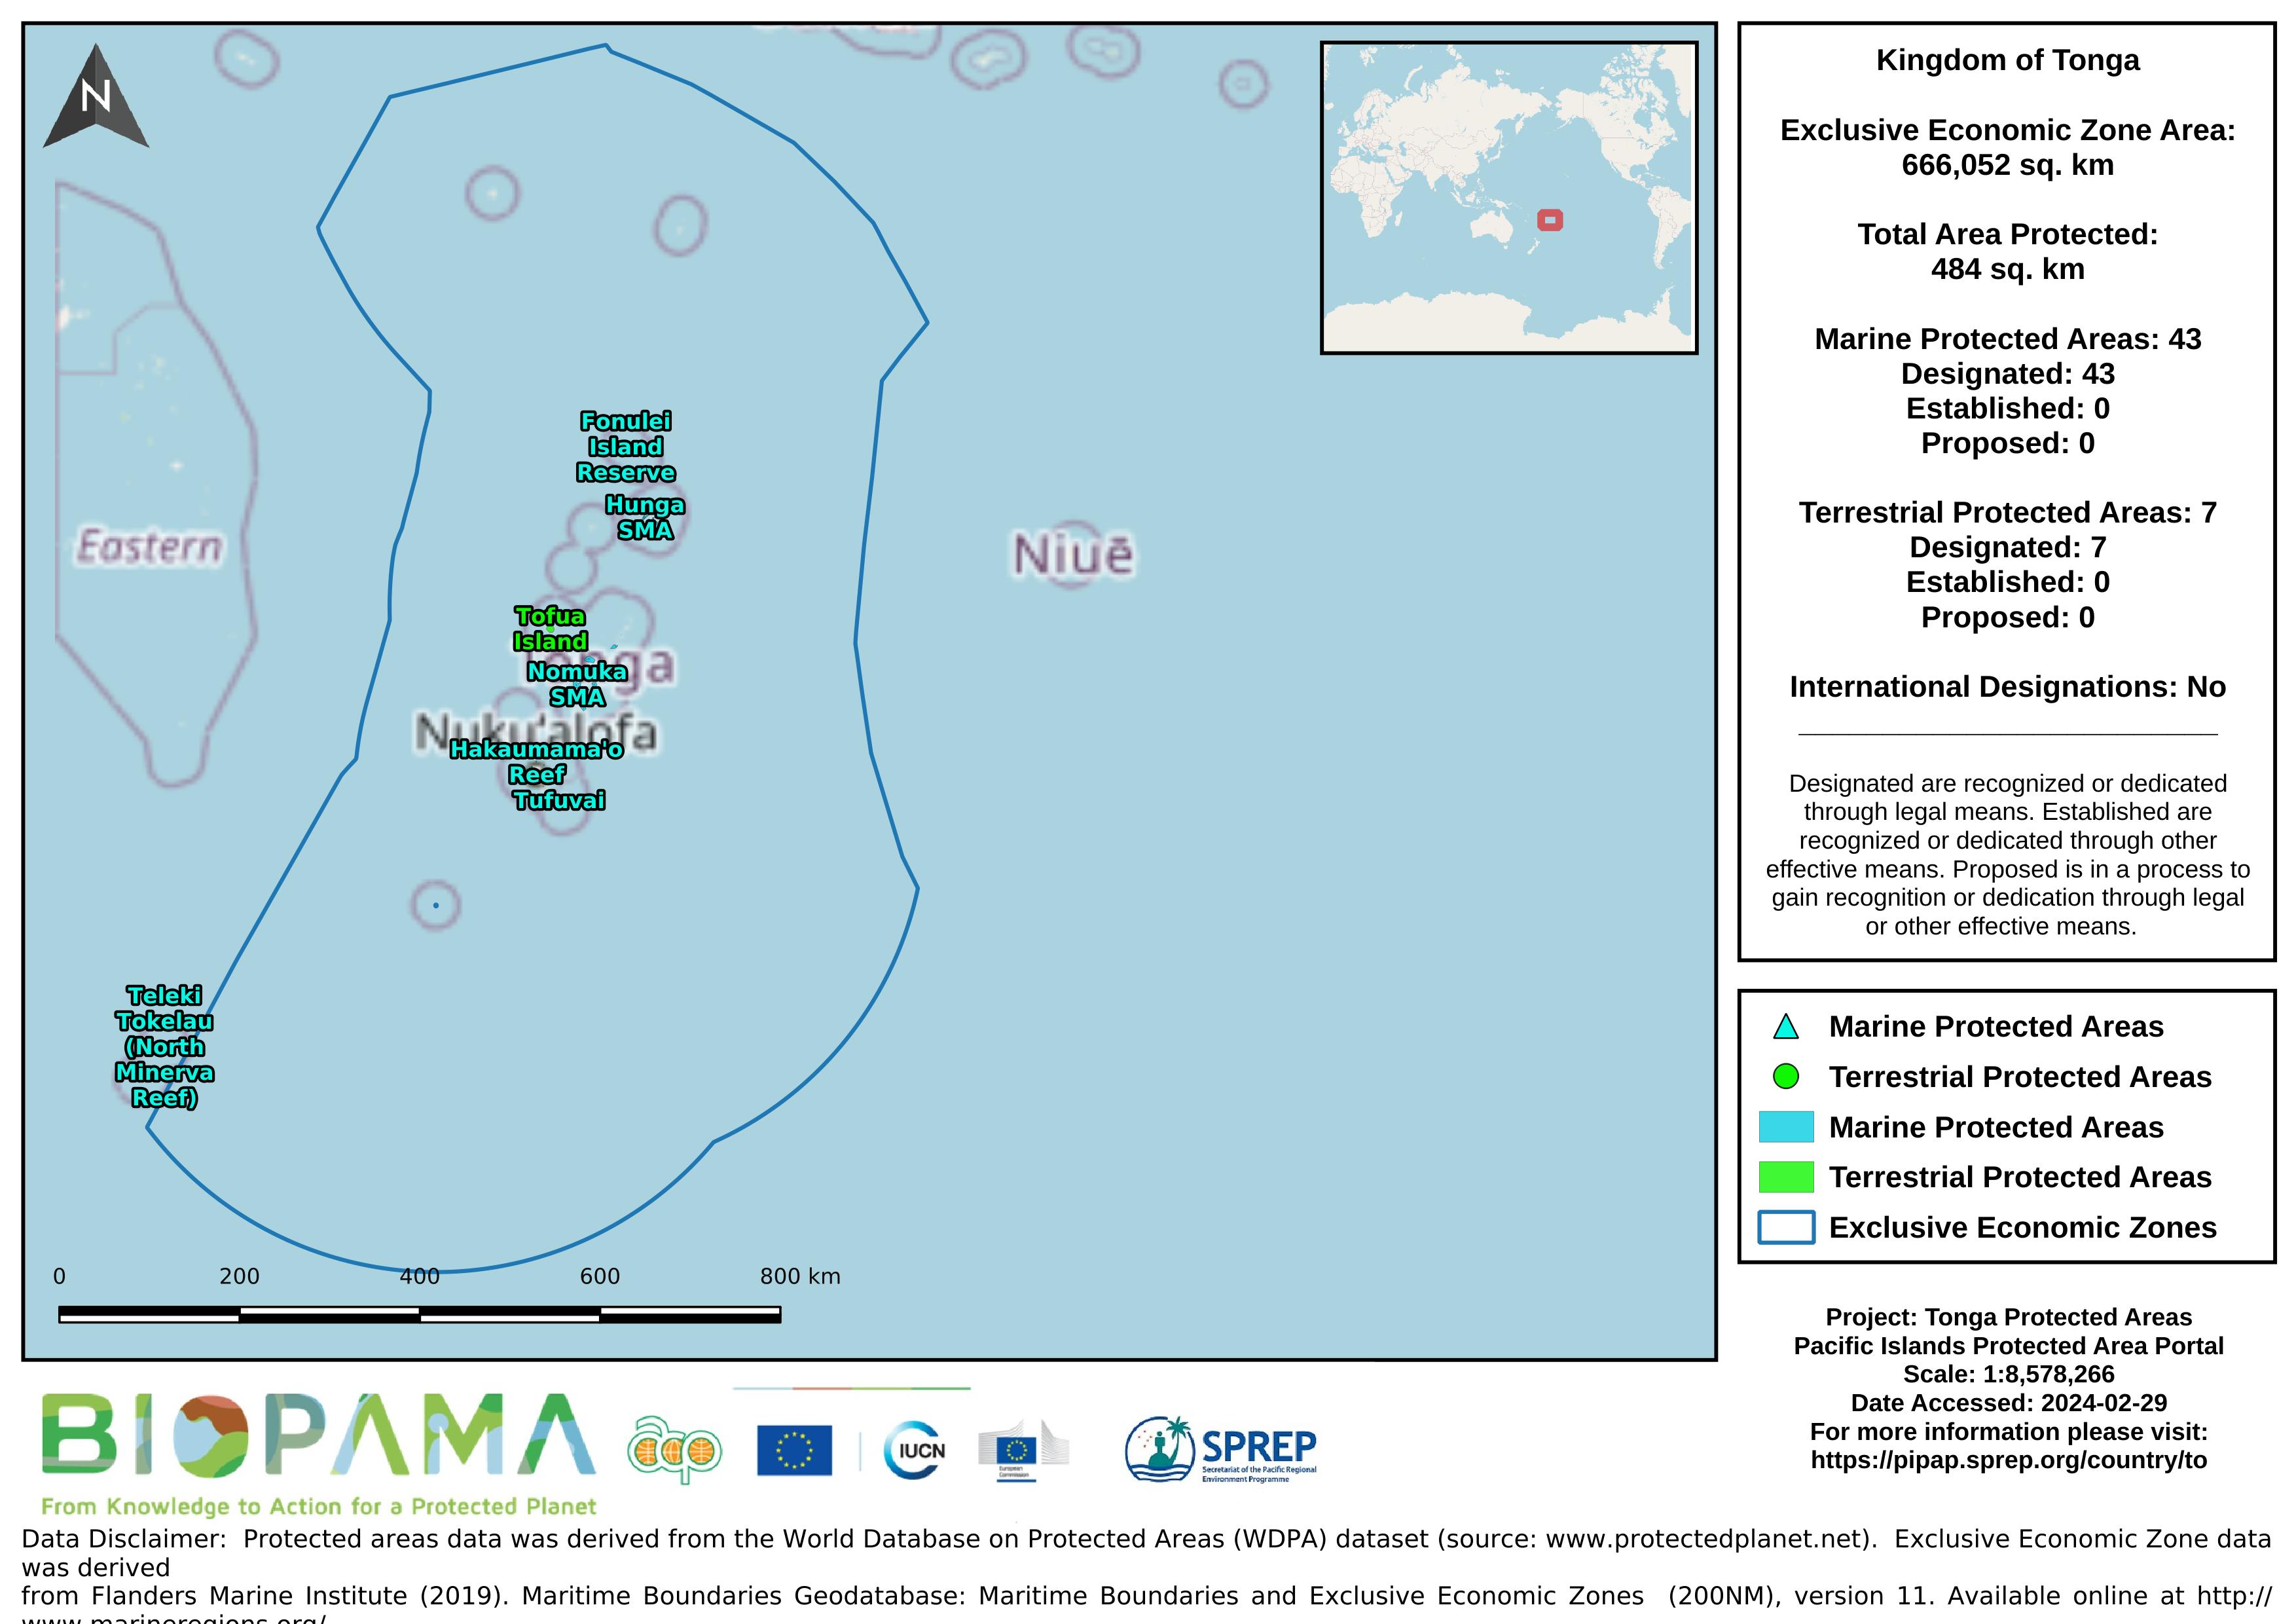
Map of the protected areas for Tonga with country-level summary statistics on the amount of area under protection, count for each type of protected area (terrestrial or marine), and the count of their designation.
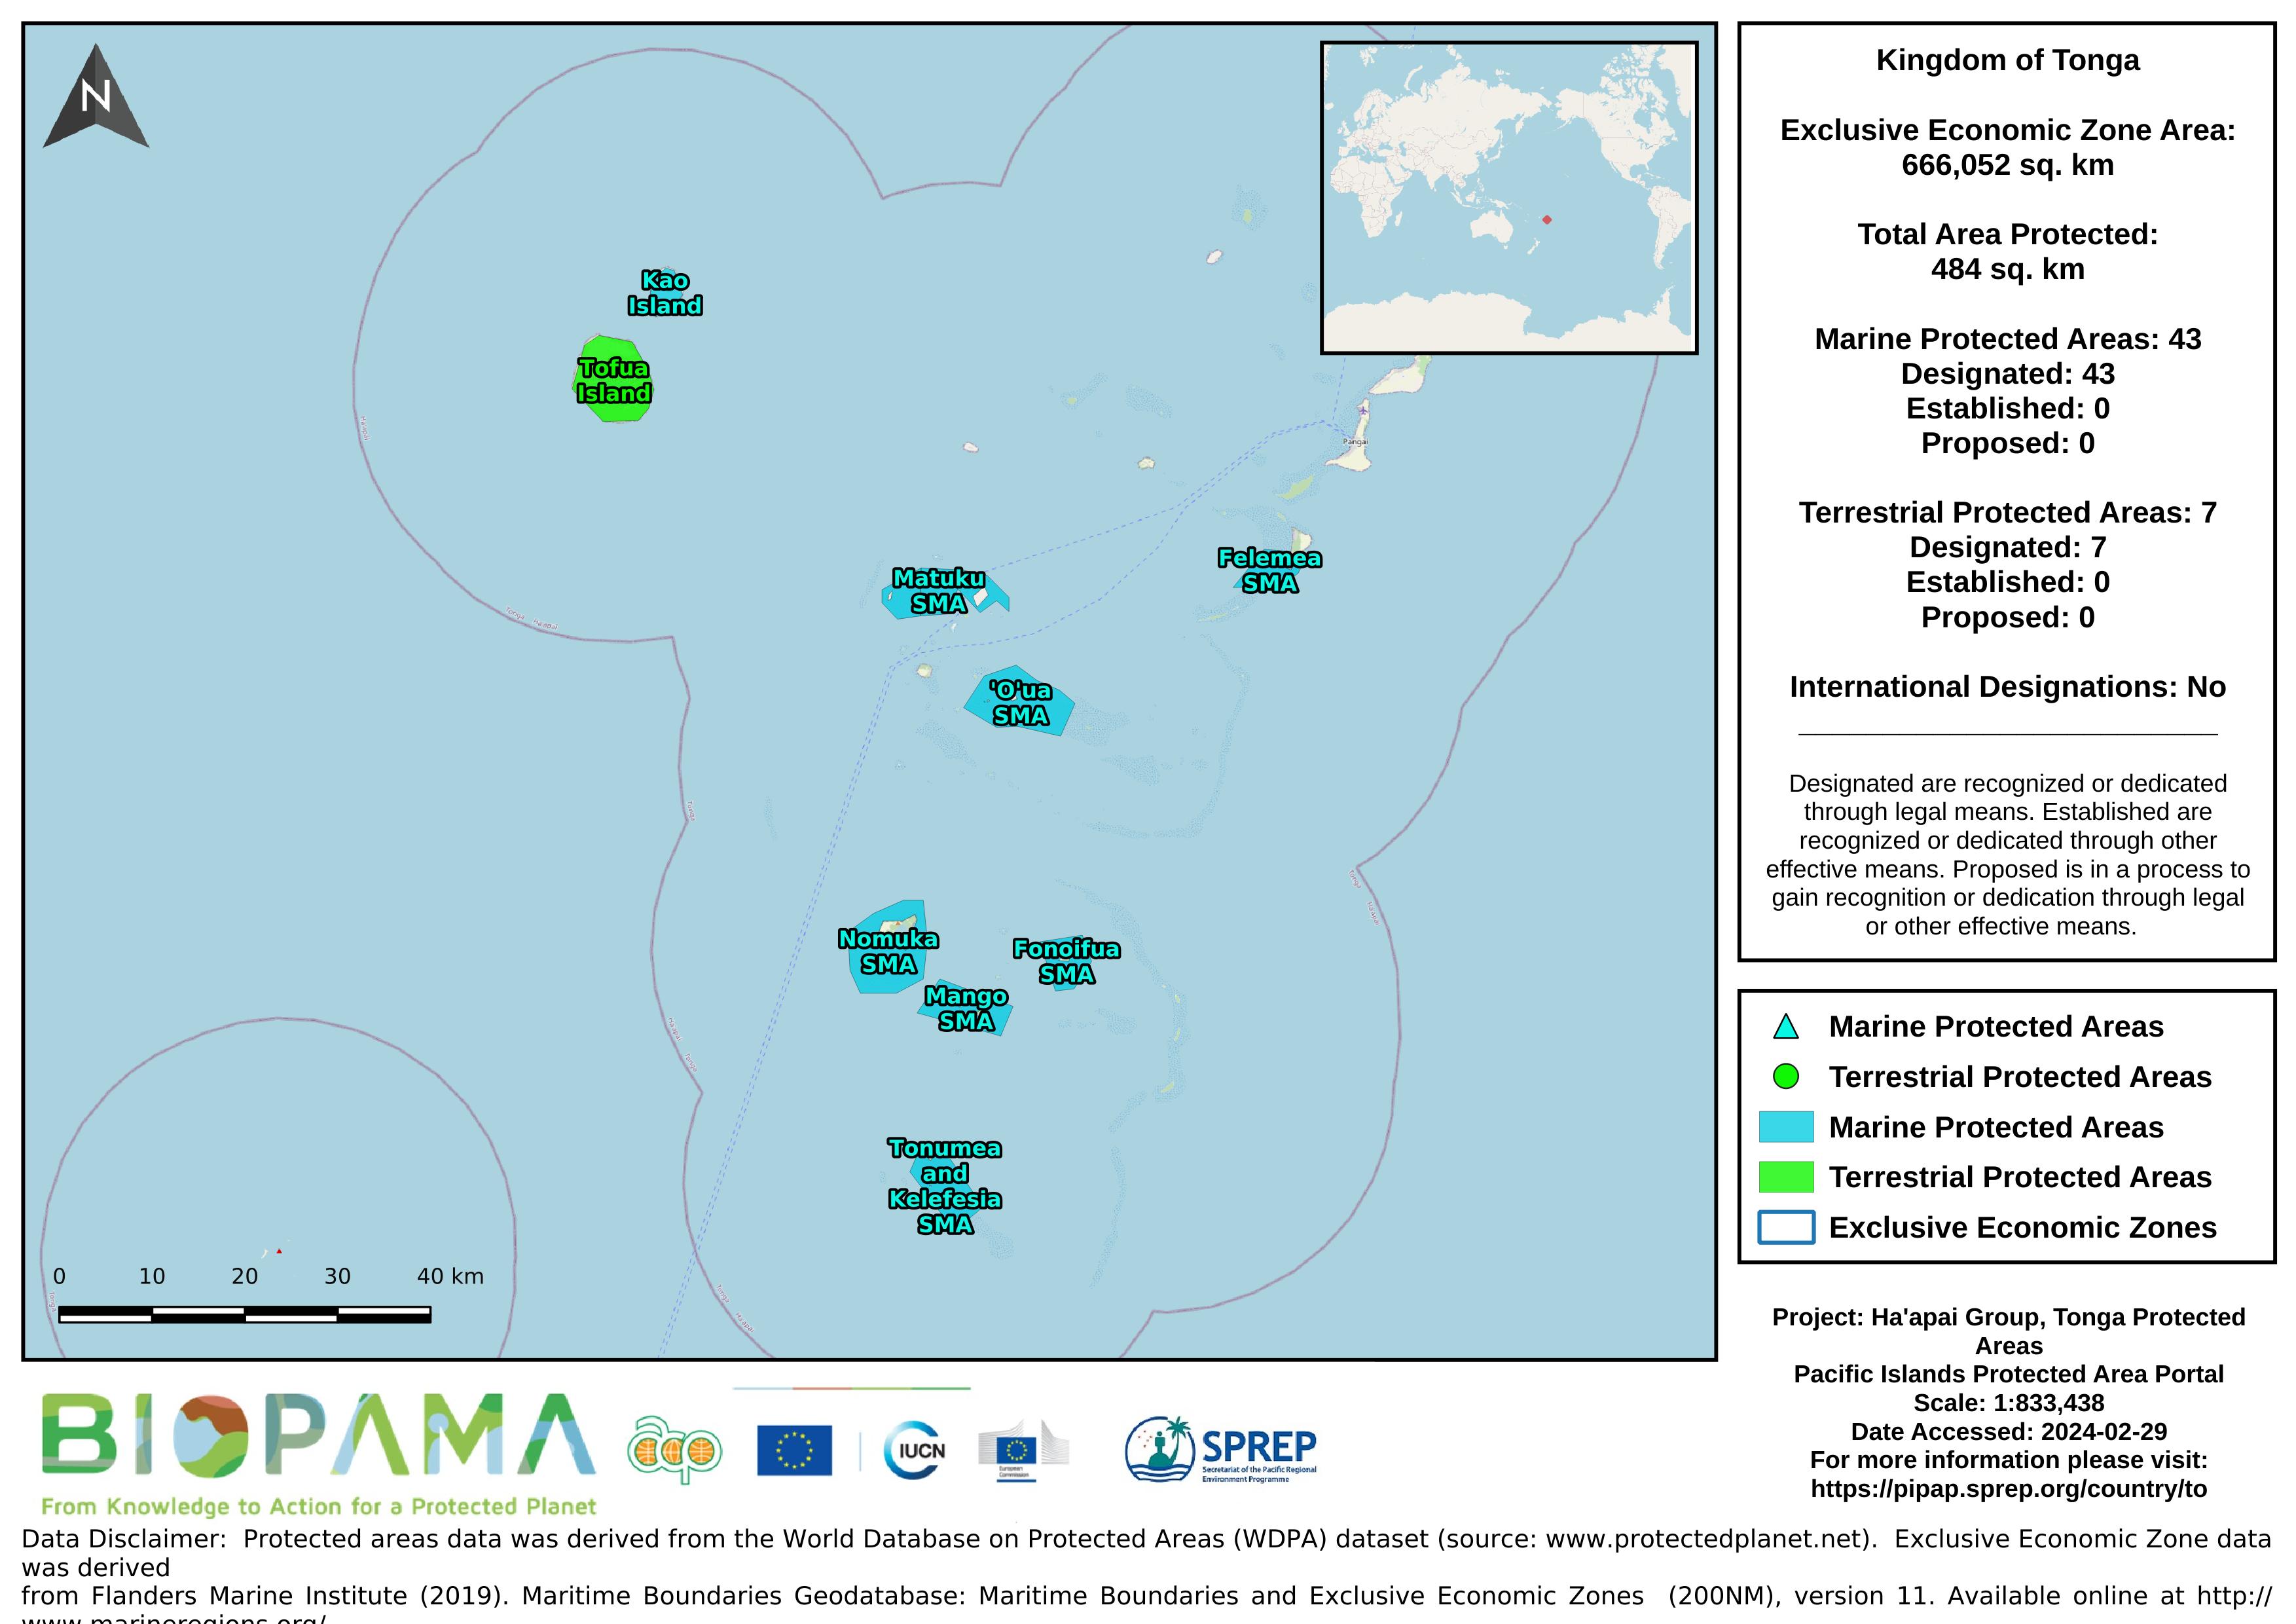
Map of the protected areas for the Ha'apai Group, Tonga with country-level summary statistics on the amount of area under protection, count for each type of protected area (terrestrial or marine), and the count of their designation.
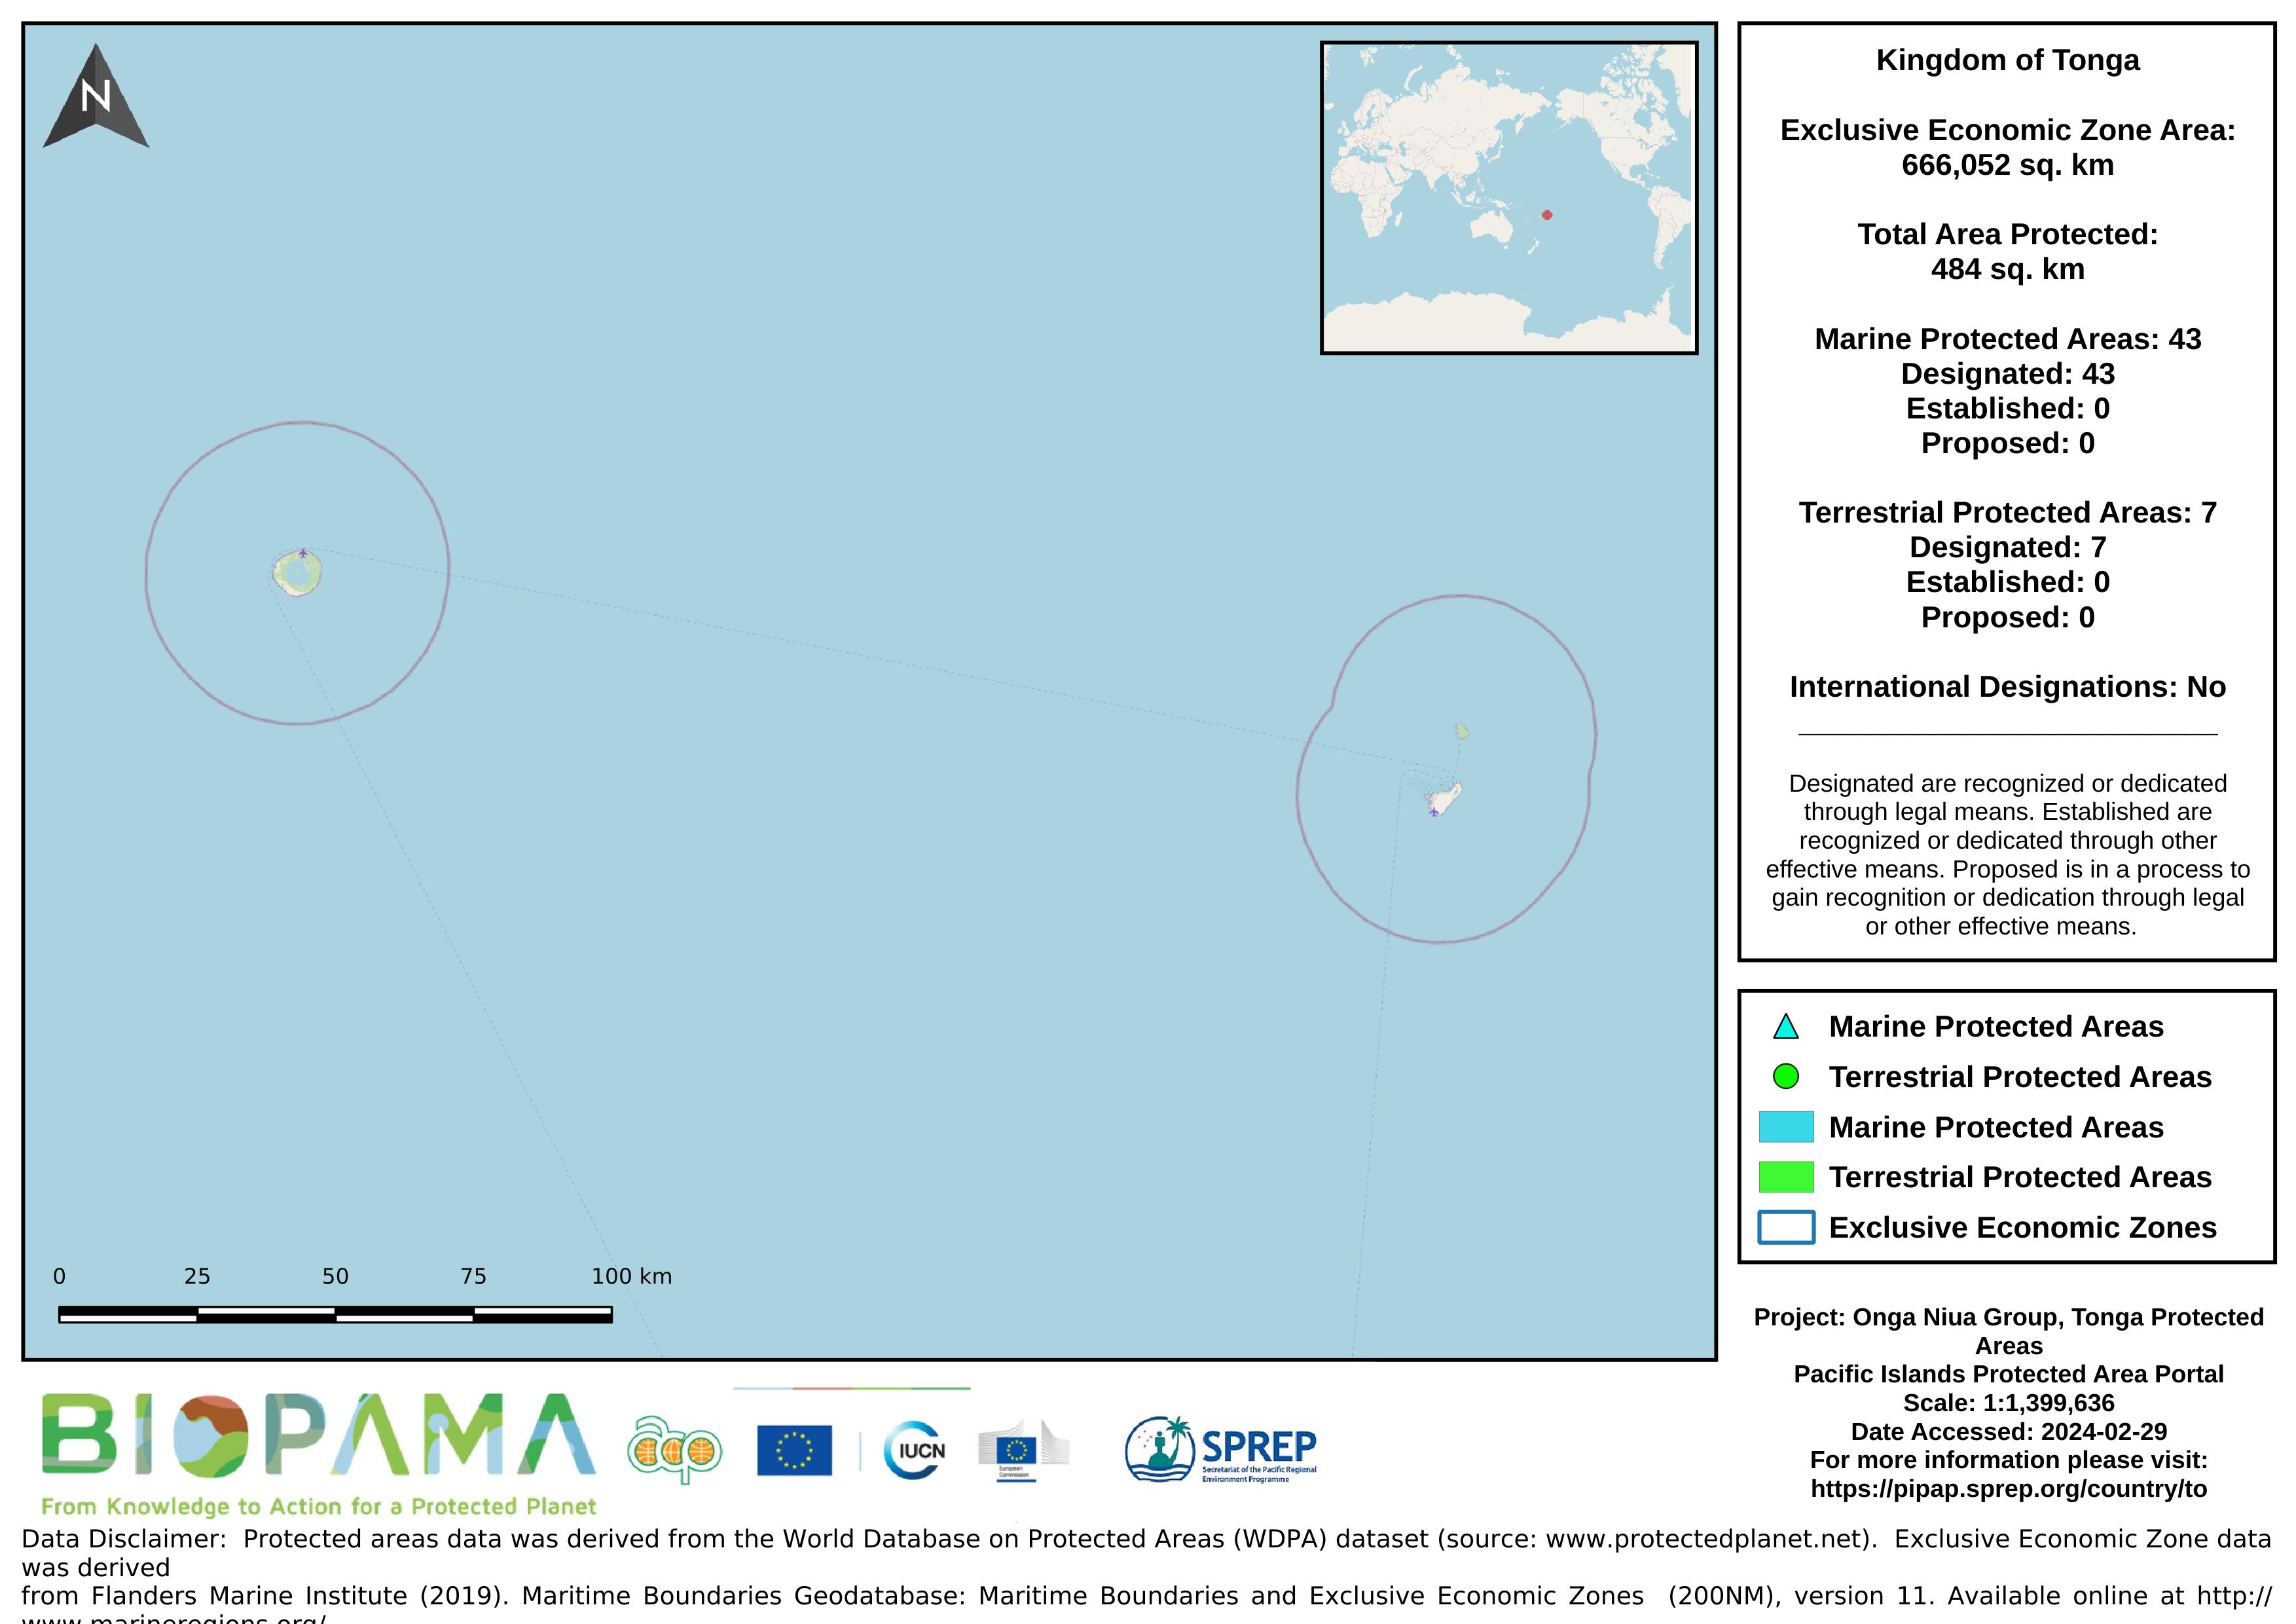
Map of the protected areas for the Niuas Group, Tonga with country-level summary statistics on the amount of area under protection, count for each type of protected area (terrestrial or marine), and the count of their designation.
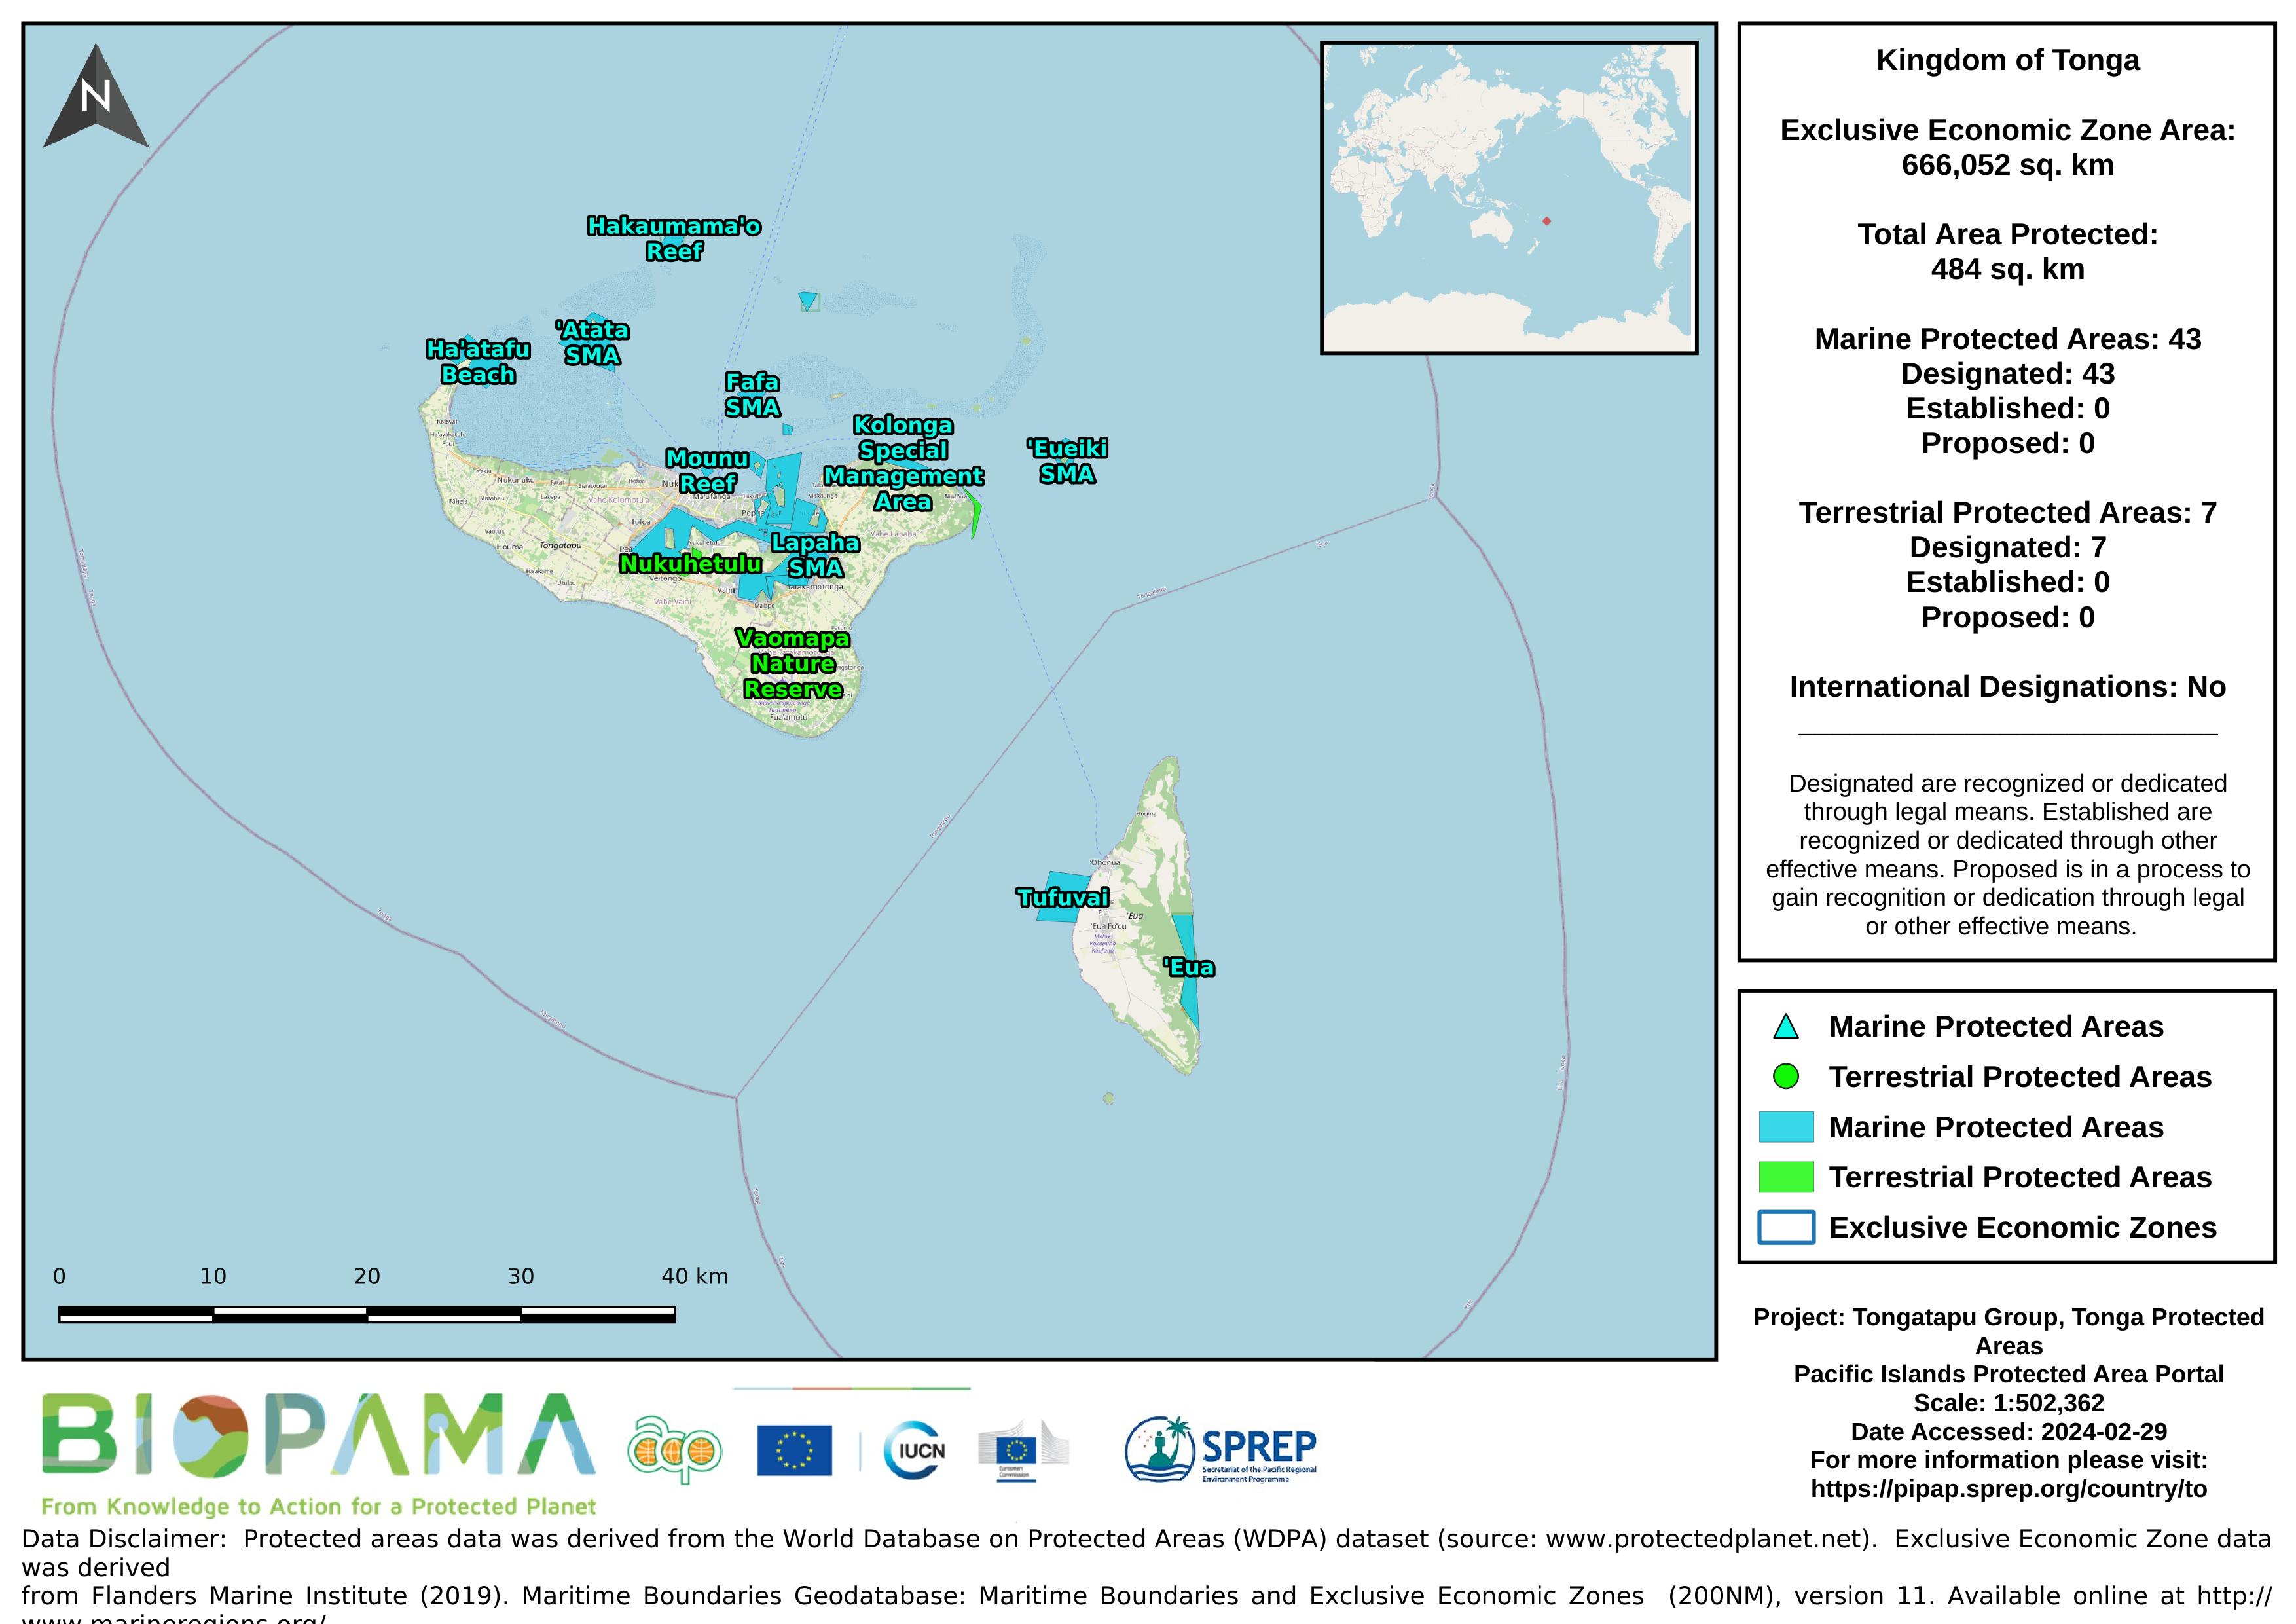
Map of the protected areas for the Tongatapu Group, Tonga with country-level summary statistics on the amount of area under protection, count for each type of protected area (terrestrial or marine), and the count of their designation.
Map of the protected areas for the Vava'u Group, Tonga with country-level summary statistics on the amount of area under protection, count for each type of protected area (terrestrial or marine), and the count of their designation.
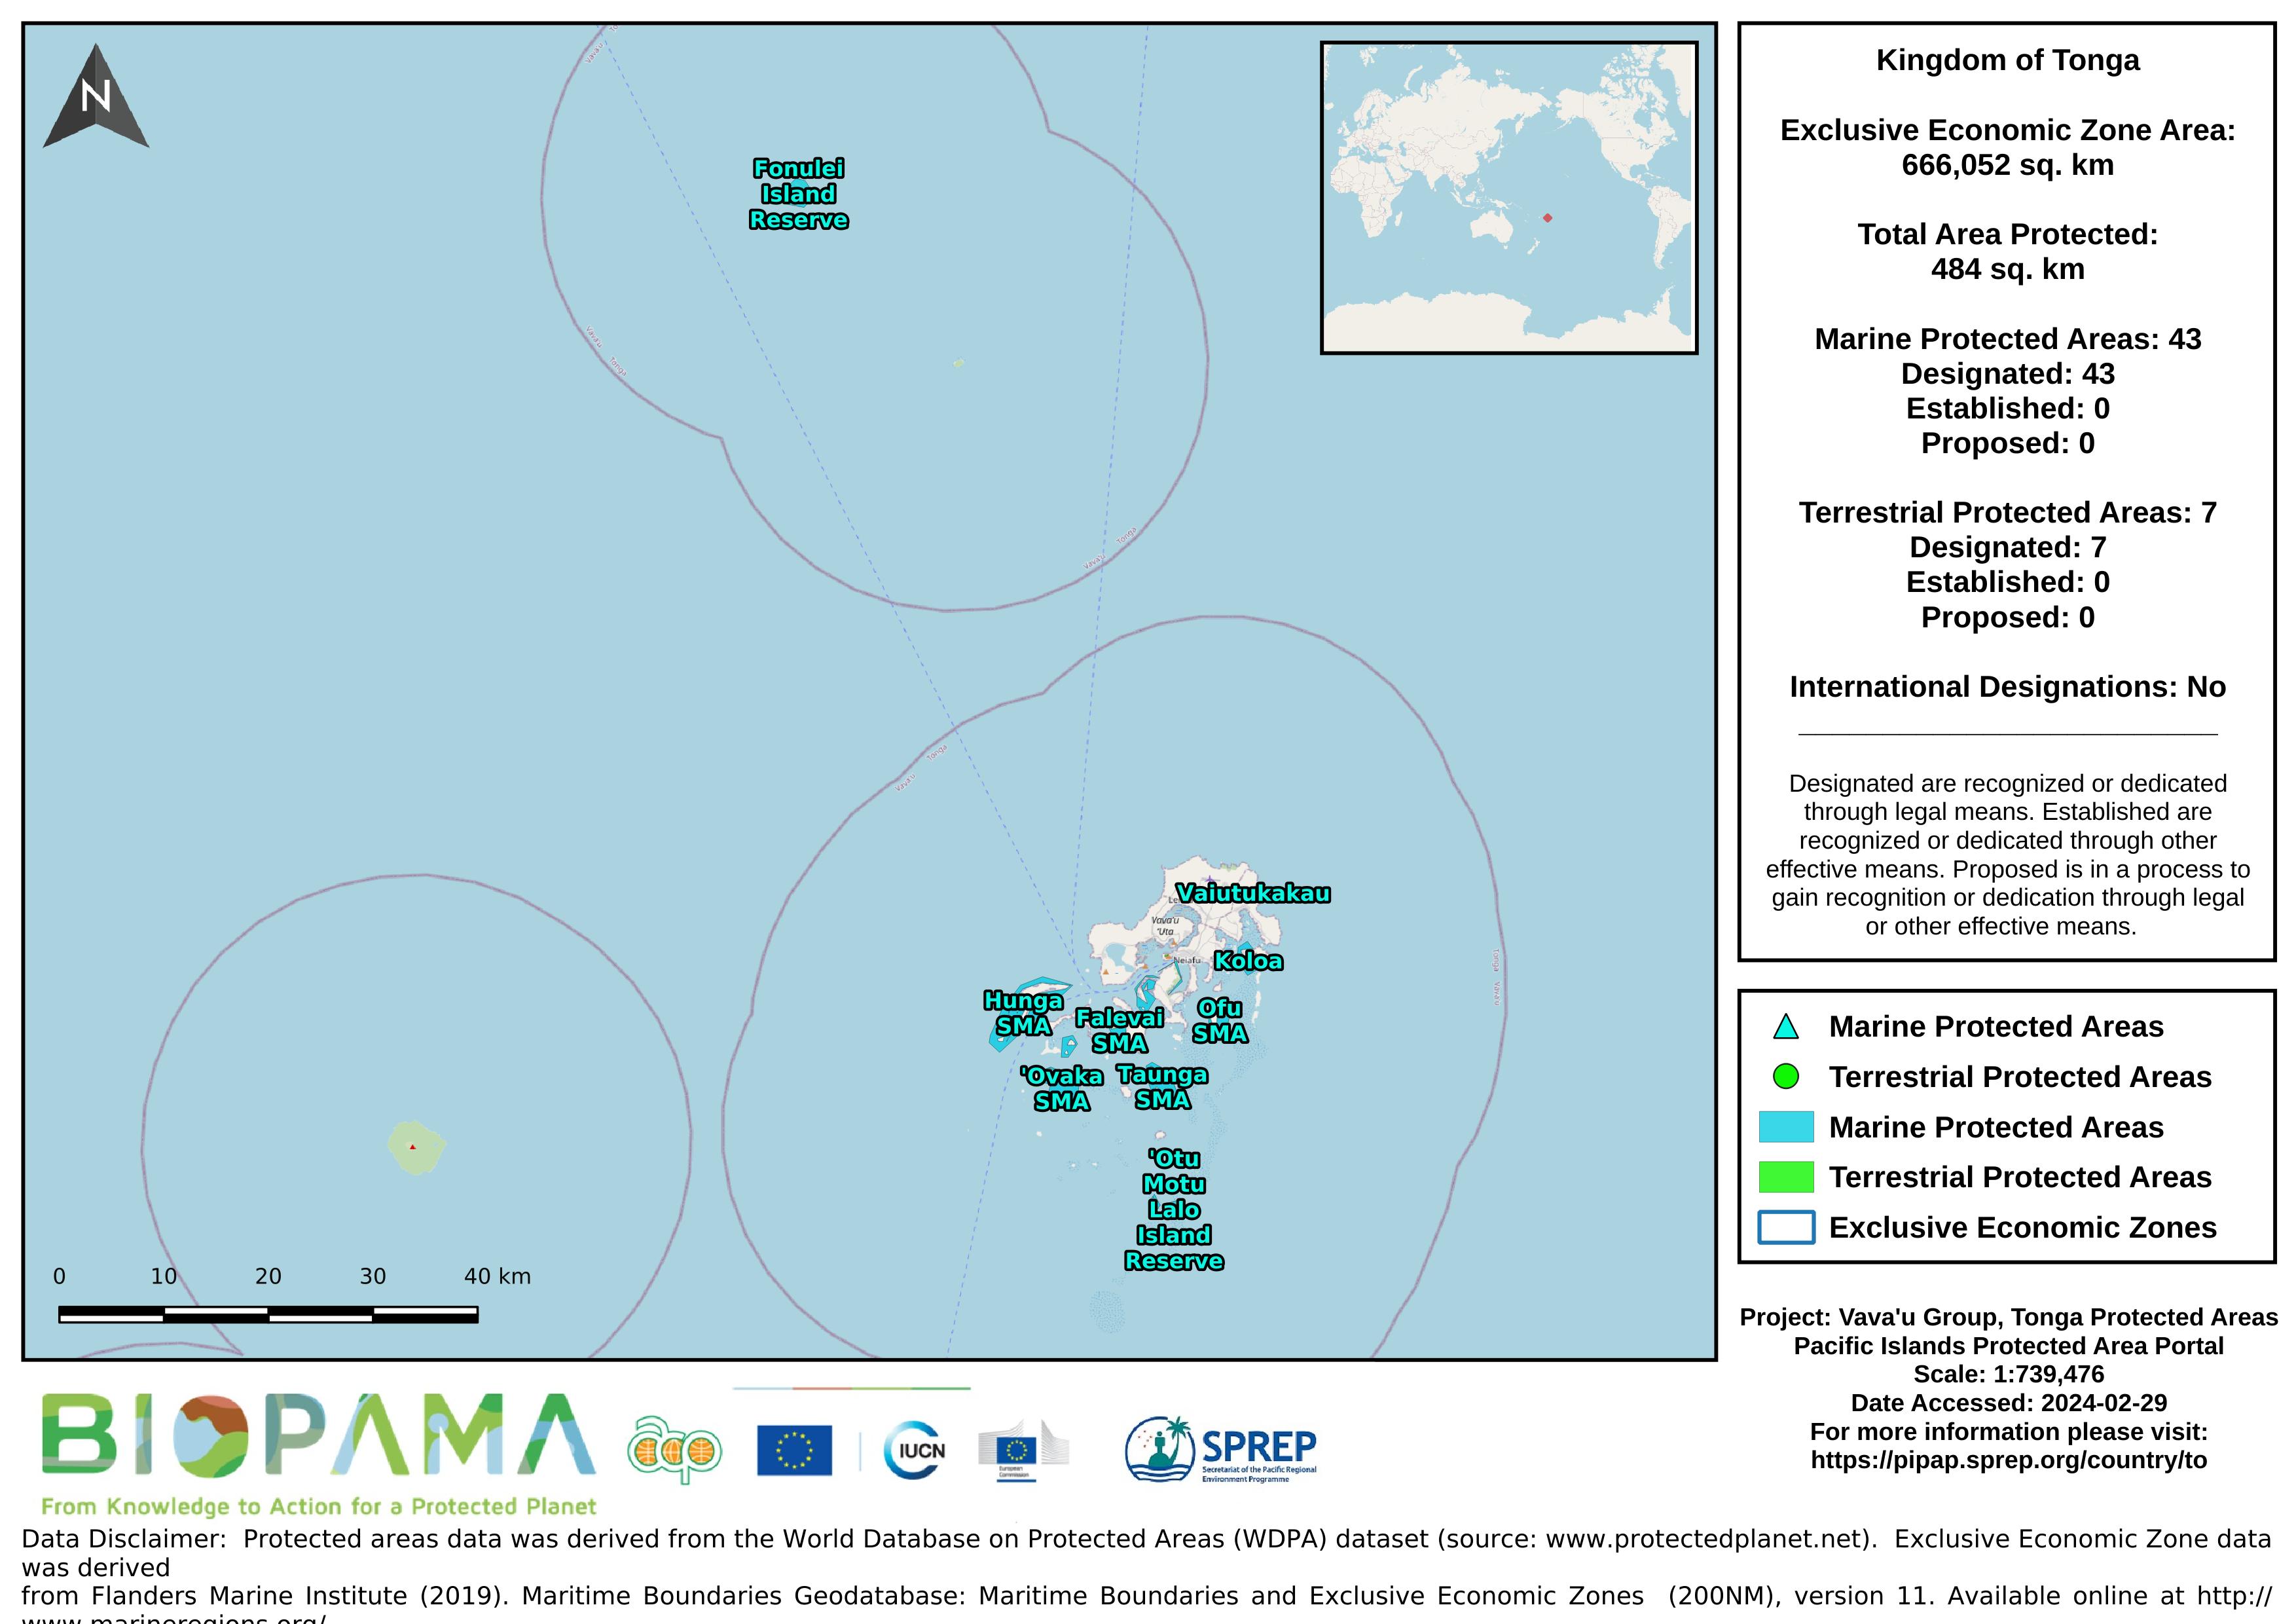
Environmental conditions and anthropogenic impacts are key influences on ecological processes and associated ecosystem services. Effective management of Tonga’s marine ecosystems therefore depends on accurate and up-to-date knowledge of environmental and anthropogenic variables. Although many types of environmental and anthropogenic data are now available in global layers, they are often inaccessible to end users, particularly in developing countries with limited accessibility and analytical training.
In a unique move Tokelau requested all regional and international organizations that it is affiliated to either through full membership, associate or by accessing through regional international projects, to visit and consult Tokelau as a "body corporate" or all at once. The intention is to assist a small tiny country in managing all the possible assistance available from these organizations so that the actual assistance itself could be much more effective in their delivery and avoid duplication.
The Institute for Marine Remote Sensing (IMaRS) at the University of South Florida (USF) was funded by the Oceanography Program of the National Aeronautics and Space Administration (NASA) to provide an exhaustive worldwide inventory of coral reefs using high-resolution satellite imagery. By using a consistent dataset of high-resolution (30 meter) multispectral Landsat 7 images acquired between 1999 and 2002, USF characterized, mapped and estimated the extent of shallow coral reef ecosystems in the main coral reef provinces (Caribbean-Atlantic, Pacific, Indo-Pacific, Red Sea).
Spreadsheet and graph derived from table 1 of Kingdom of Tonga National Plan of Action (NPOA) Shark-Plan (2014-216)
Time series data and graph of Tonga's deepwater fishery total catch 2006-2016.
Most atoll ecosystems and a wide range of terrestrial and marine organisms, and genetic or cultivars varieties of
traditional food and other multi-purpose plants are declining in abundance and under threat of either “economic extinction” or extirpation and in need of some form of protection. The severity of the situation is greatest on those more urbanized atolls where both the biodiversity and the local knowledge of biodiversity are threatened.
*see R Thanman pdf report for more information*
Terrestrial and marine plants and animals that are rare, endangered or in short supply,
and in need of protection in the atolls of the Pacific Islands.
This excel file include four spreadsheets each representing a separate theme (EMG = Environmental Monitoring and Governance, IOE = Island and Ocean Ecosystems, CCR = Climate Change Resilience, WMPC = waste). Within each theme are the core national environment indicators (scrolling from left to right).
Metadata file for the GIS data (raster and shapefiles) for the global threats to coral reefs: acidification, future thermal stress, integrated future threats, and past thermal stress.