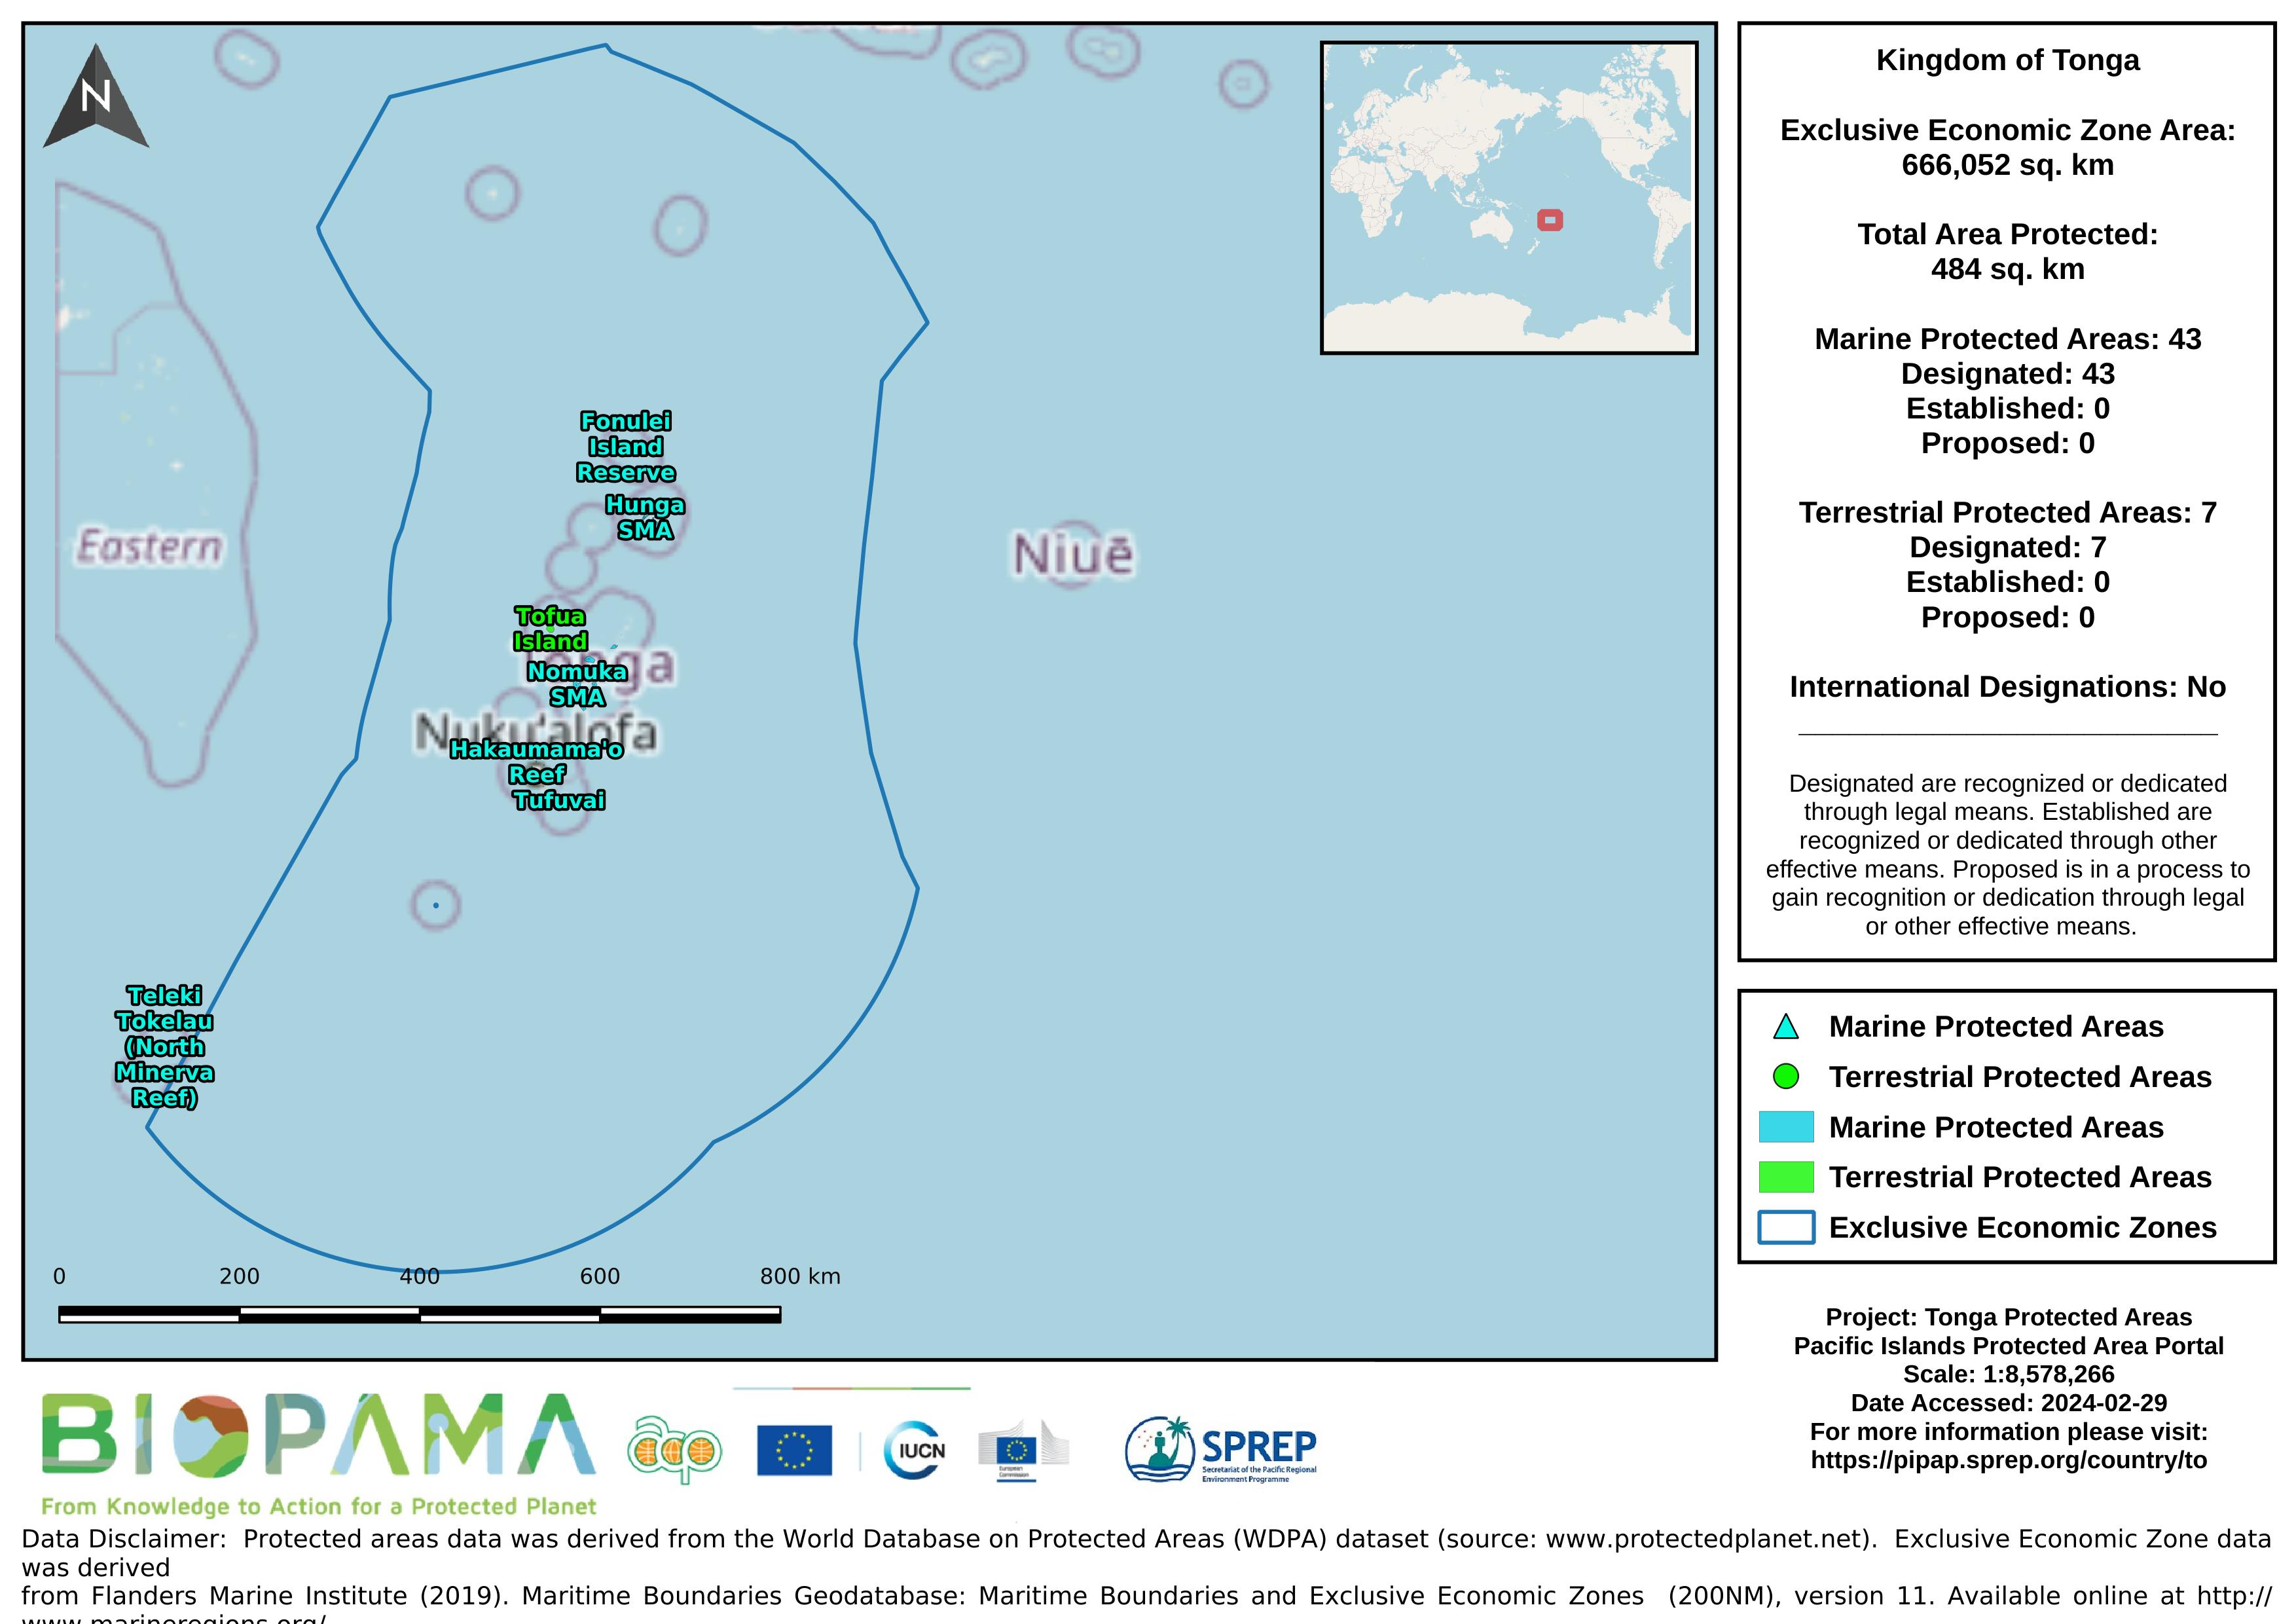
Map of the protected areas for Tonga with country-level summary statistics on the amount of area under protection, count for each type of protected area (terrestrial or marine), and the count of their designation.
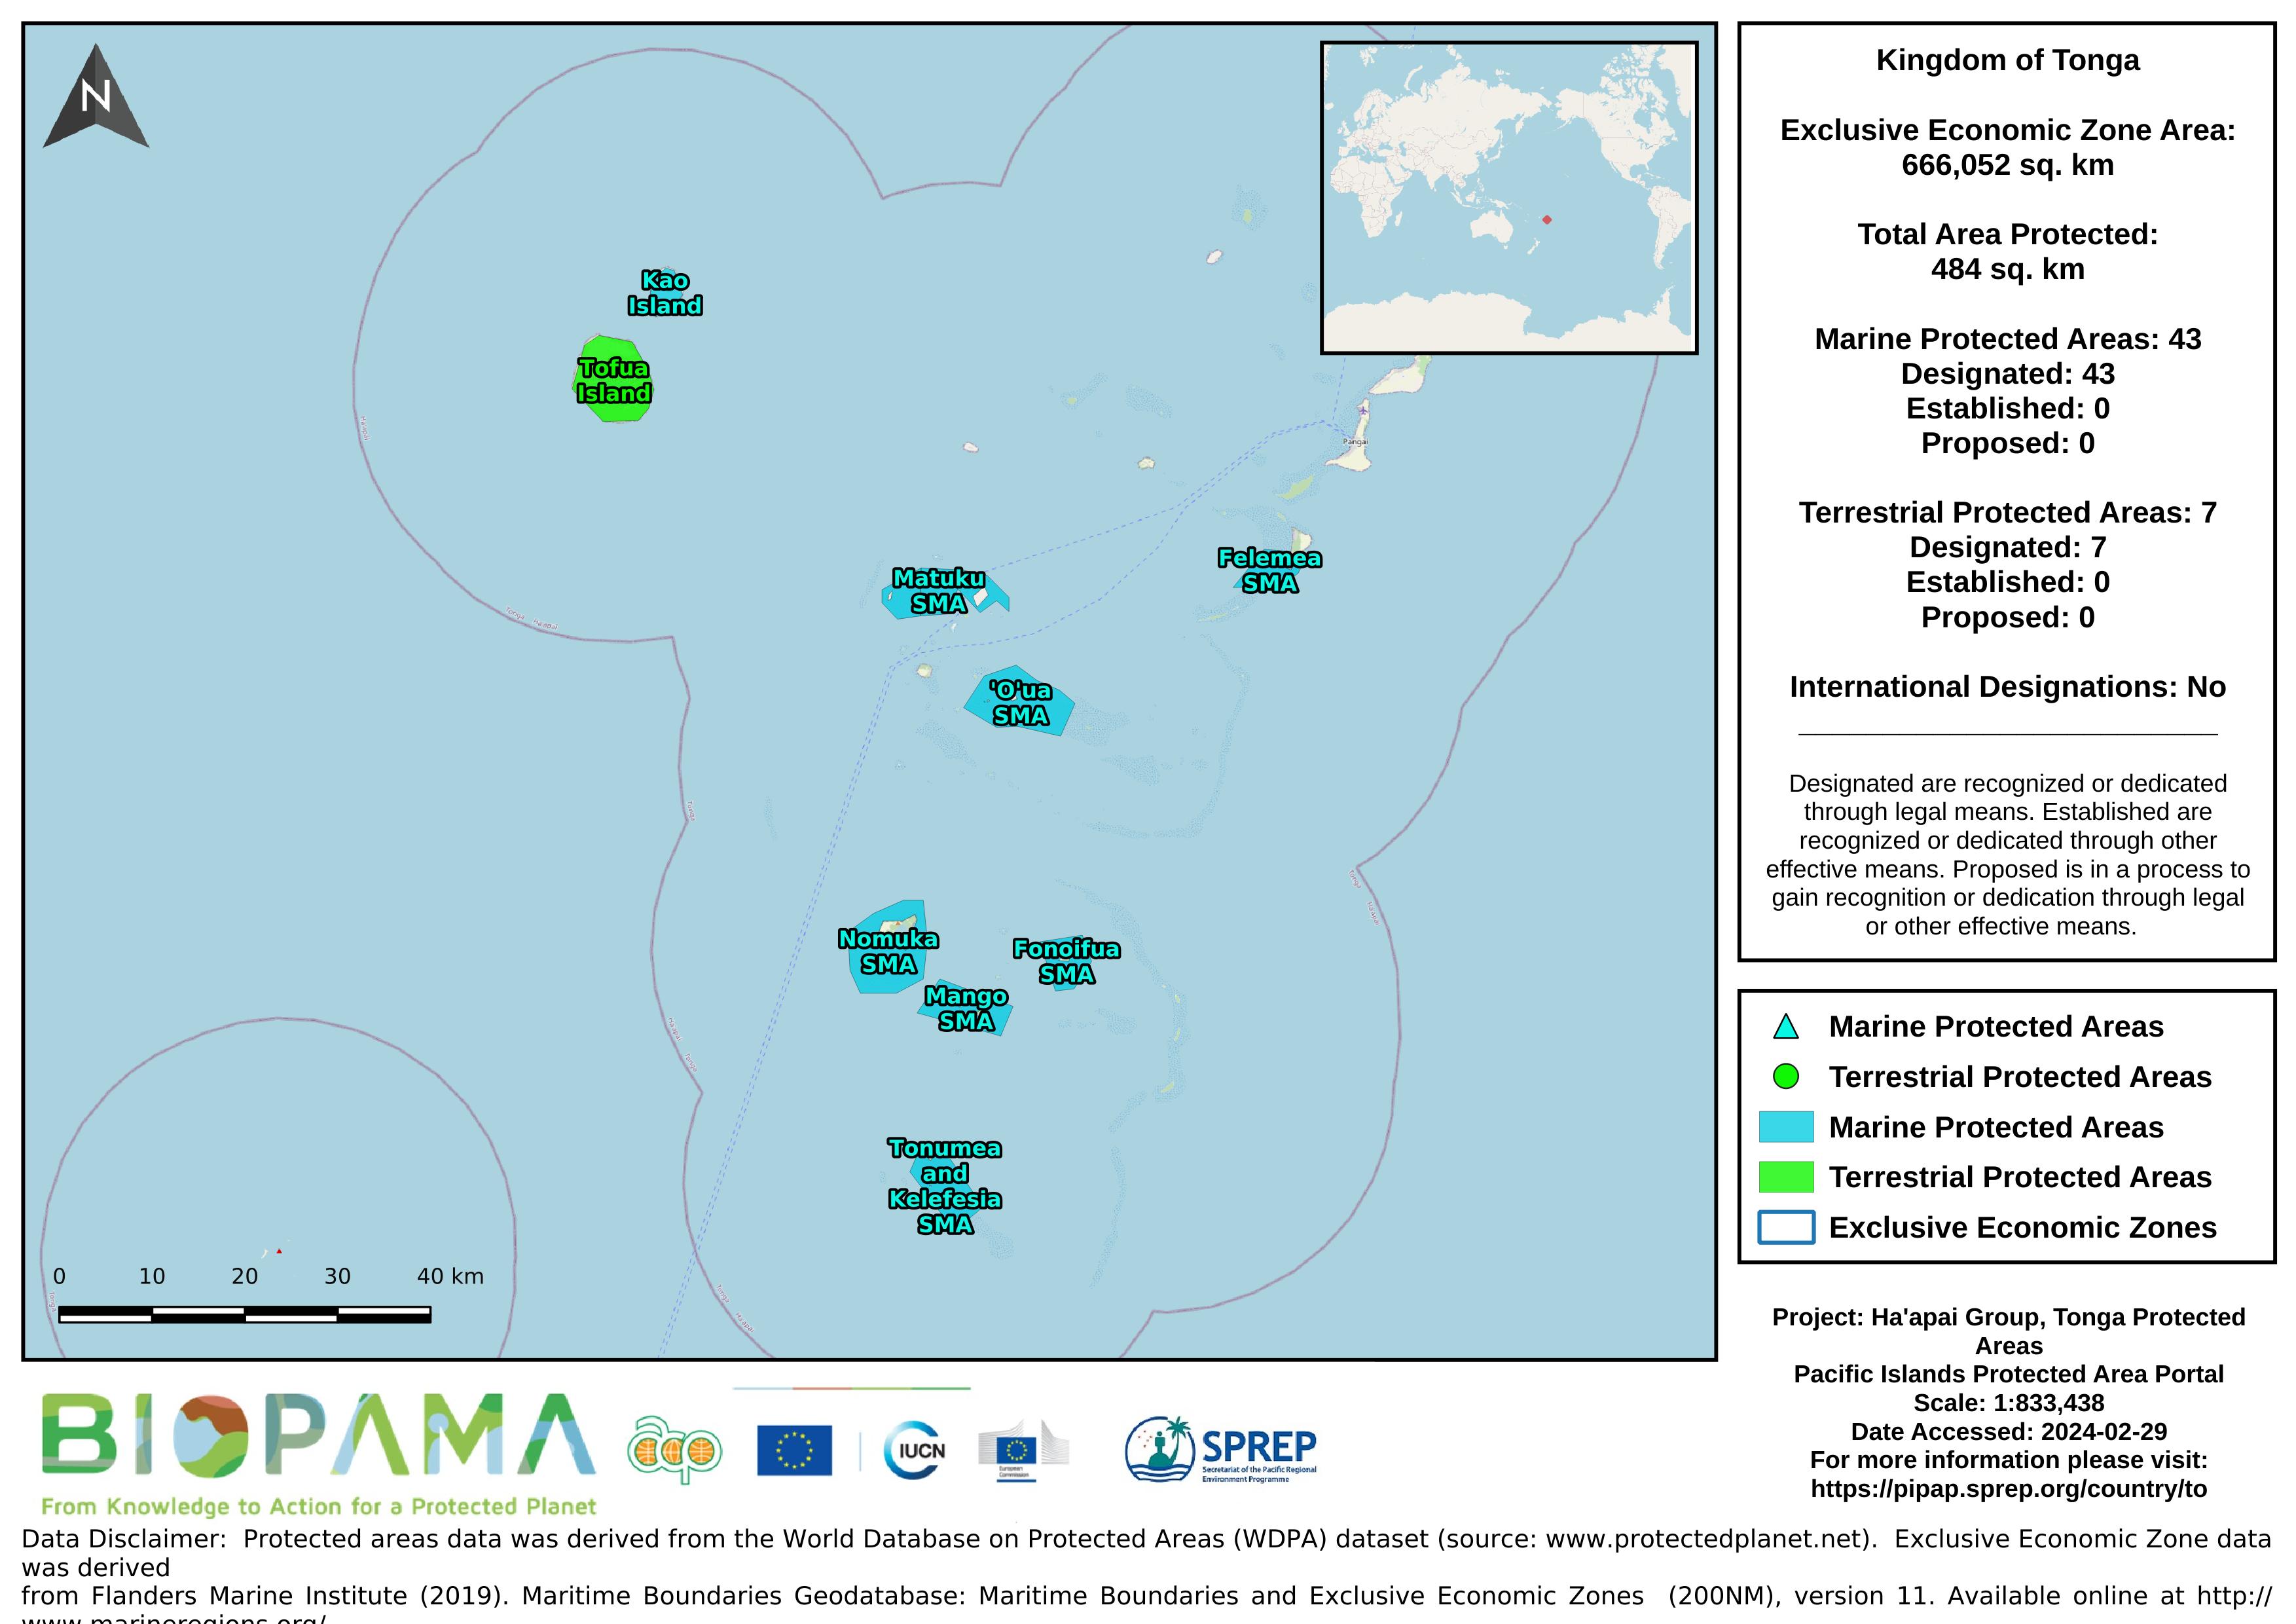
Map of the protected areas for the Ha'apai Group, Tonga with country-level summary statistics on the amount of area under protection, count for each type of protected area (terrestrial or marine), and the count of their designation.
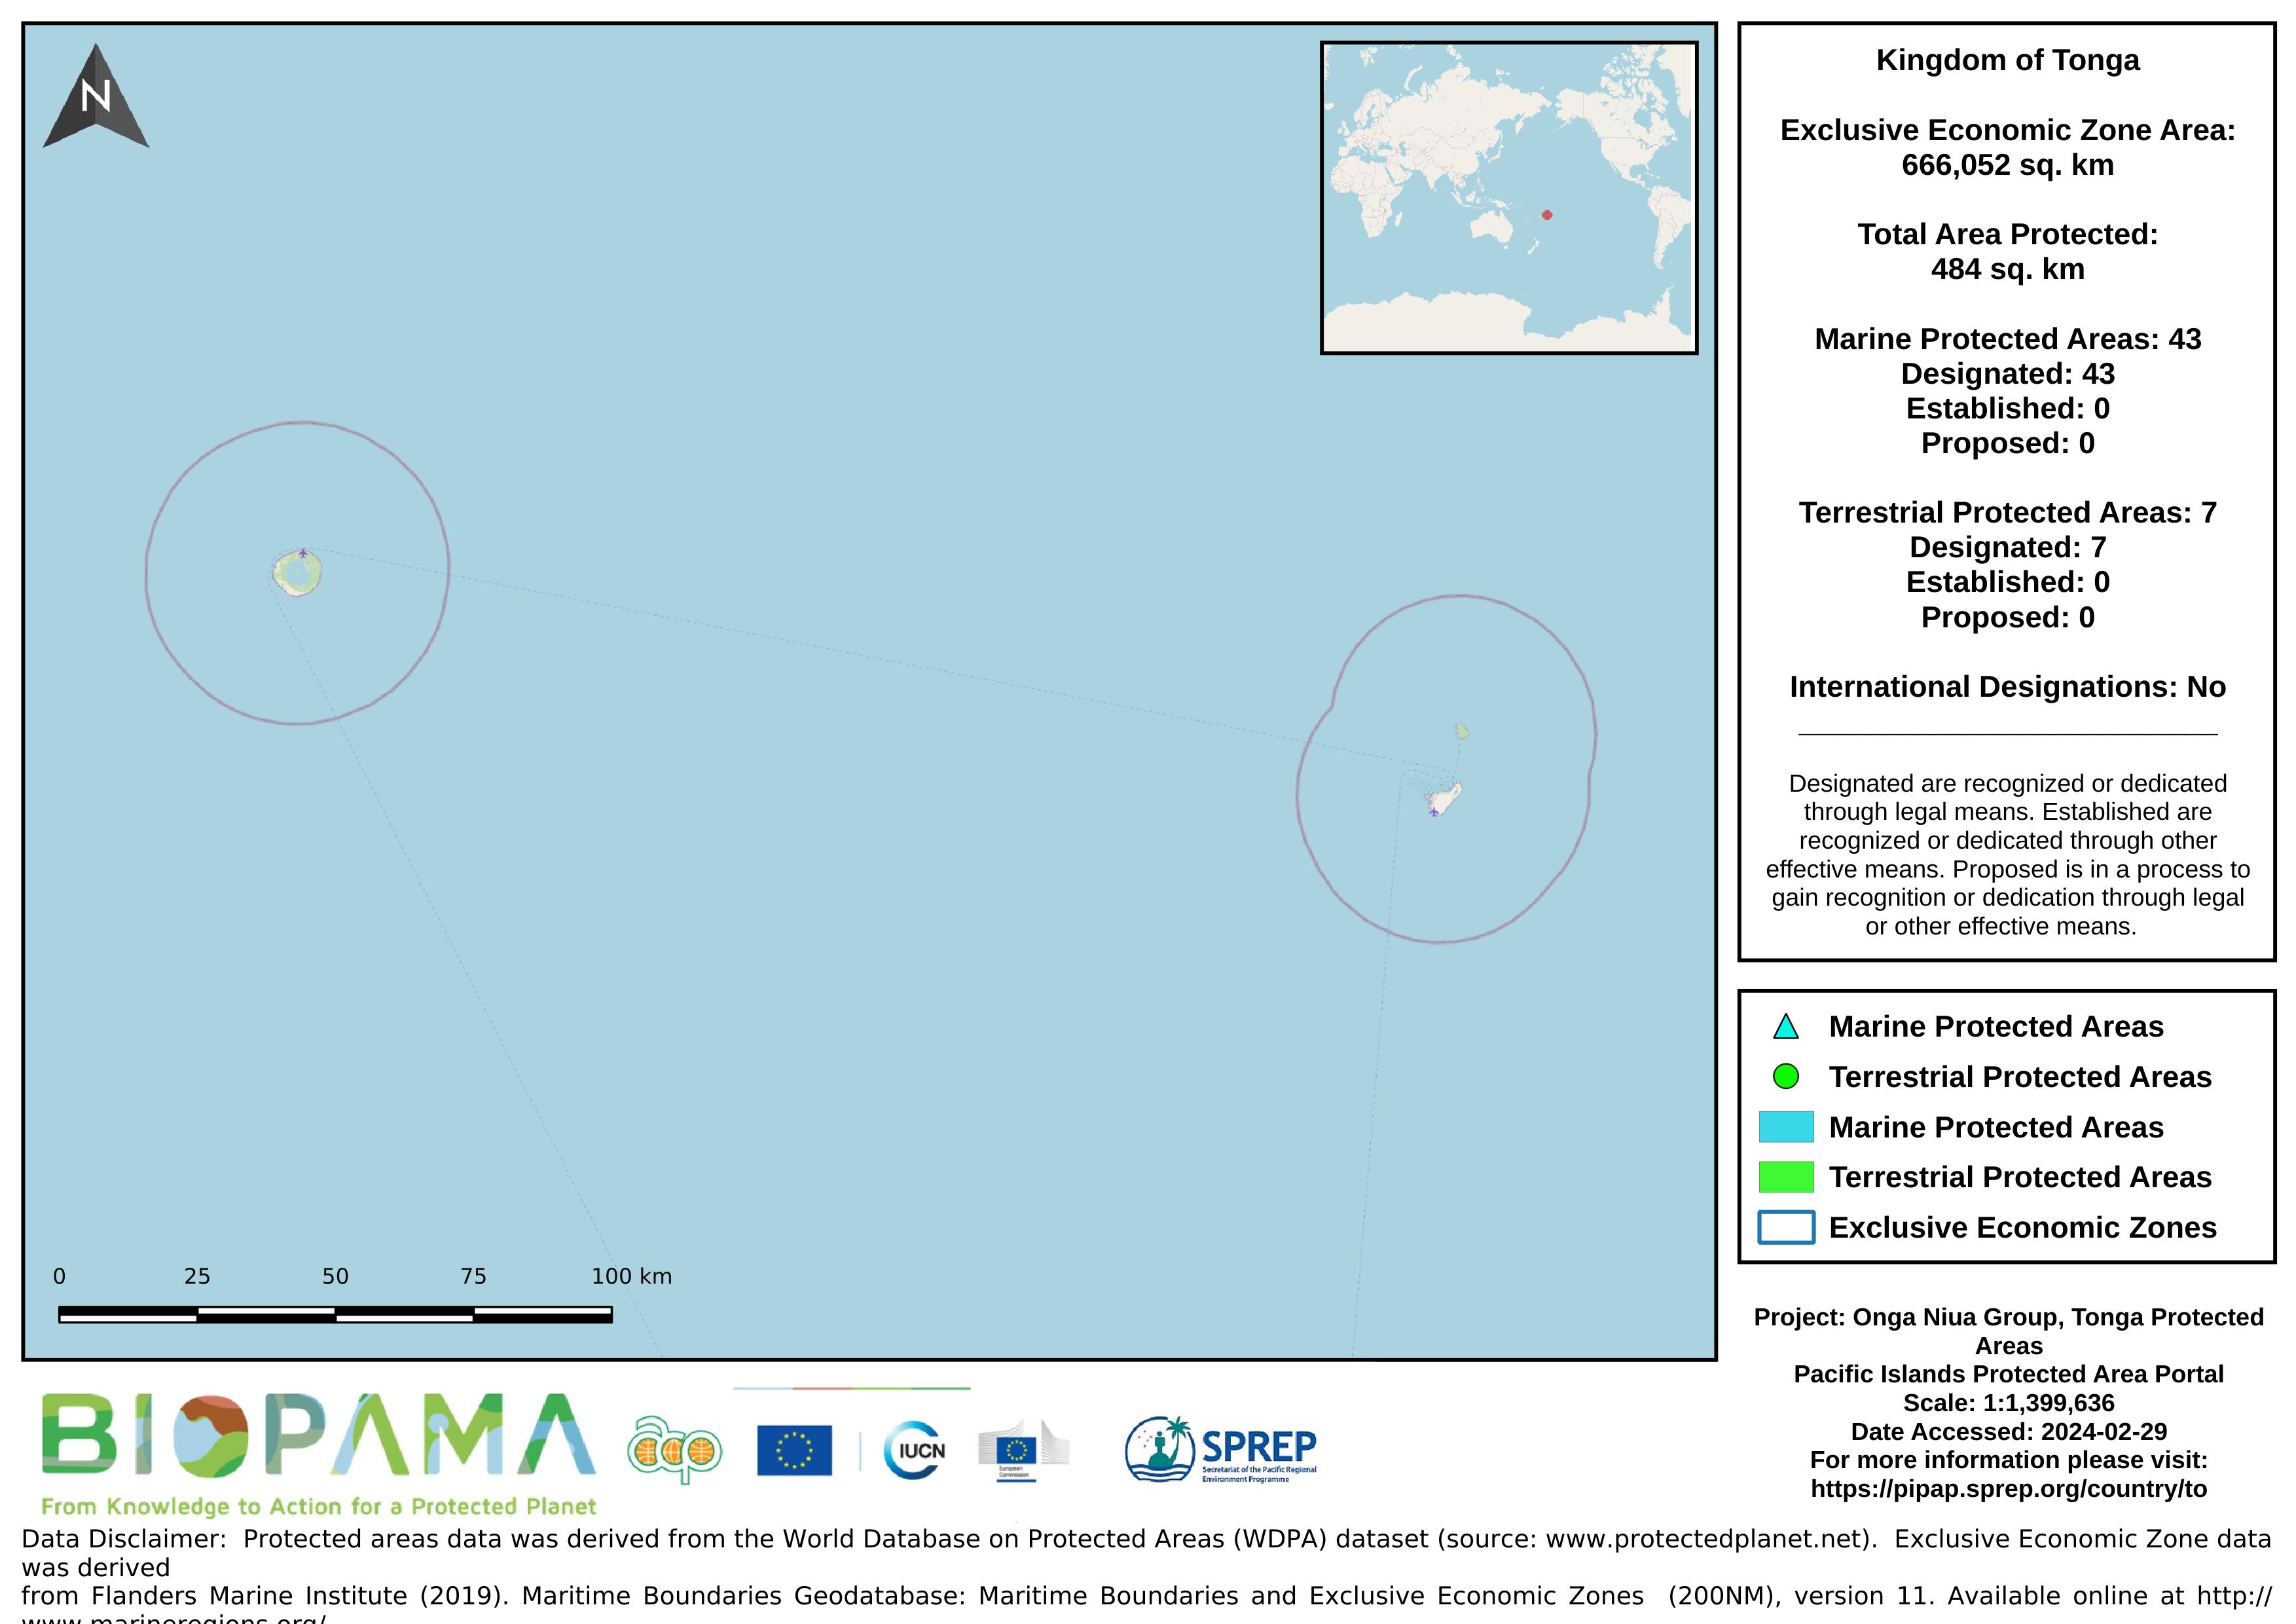
Map of the protected areas for the Niuas Group, Tonga with country-level summary statistics on the amount of area under protection, count for each type of protected area (terrestrial or marine), and the count of their designation.
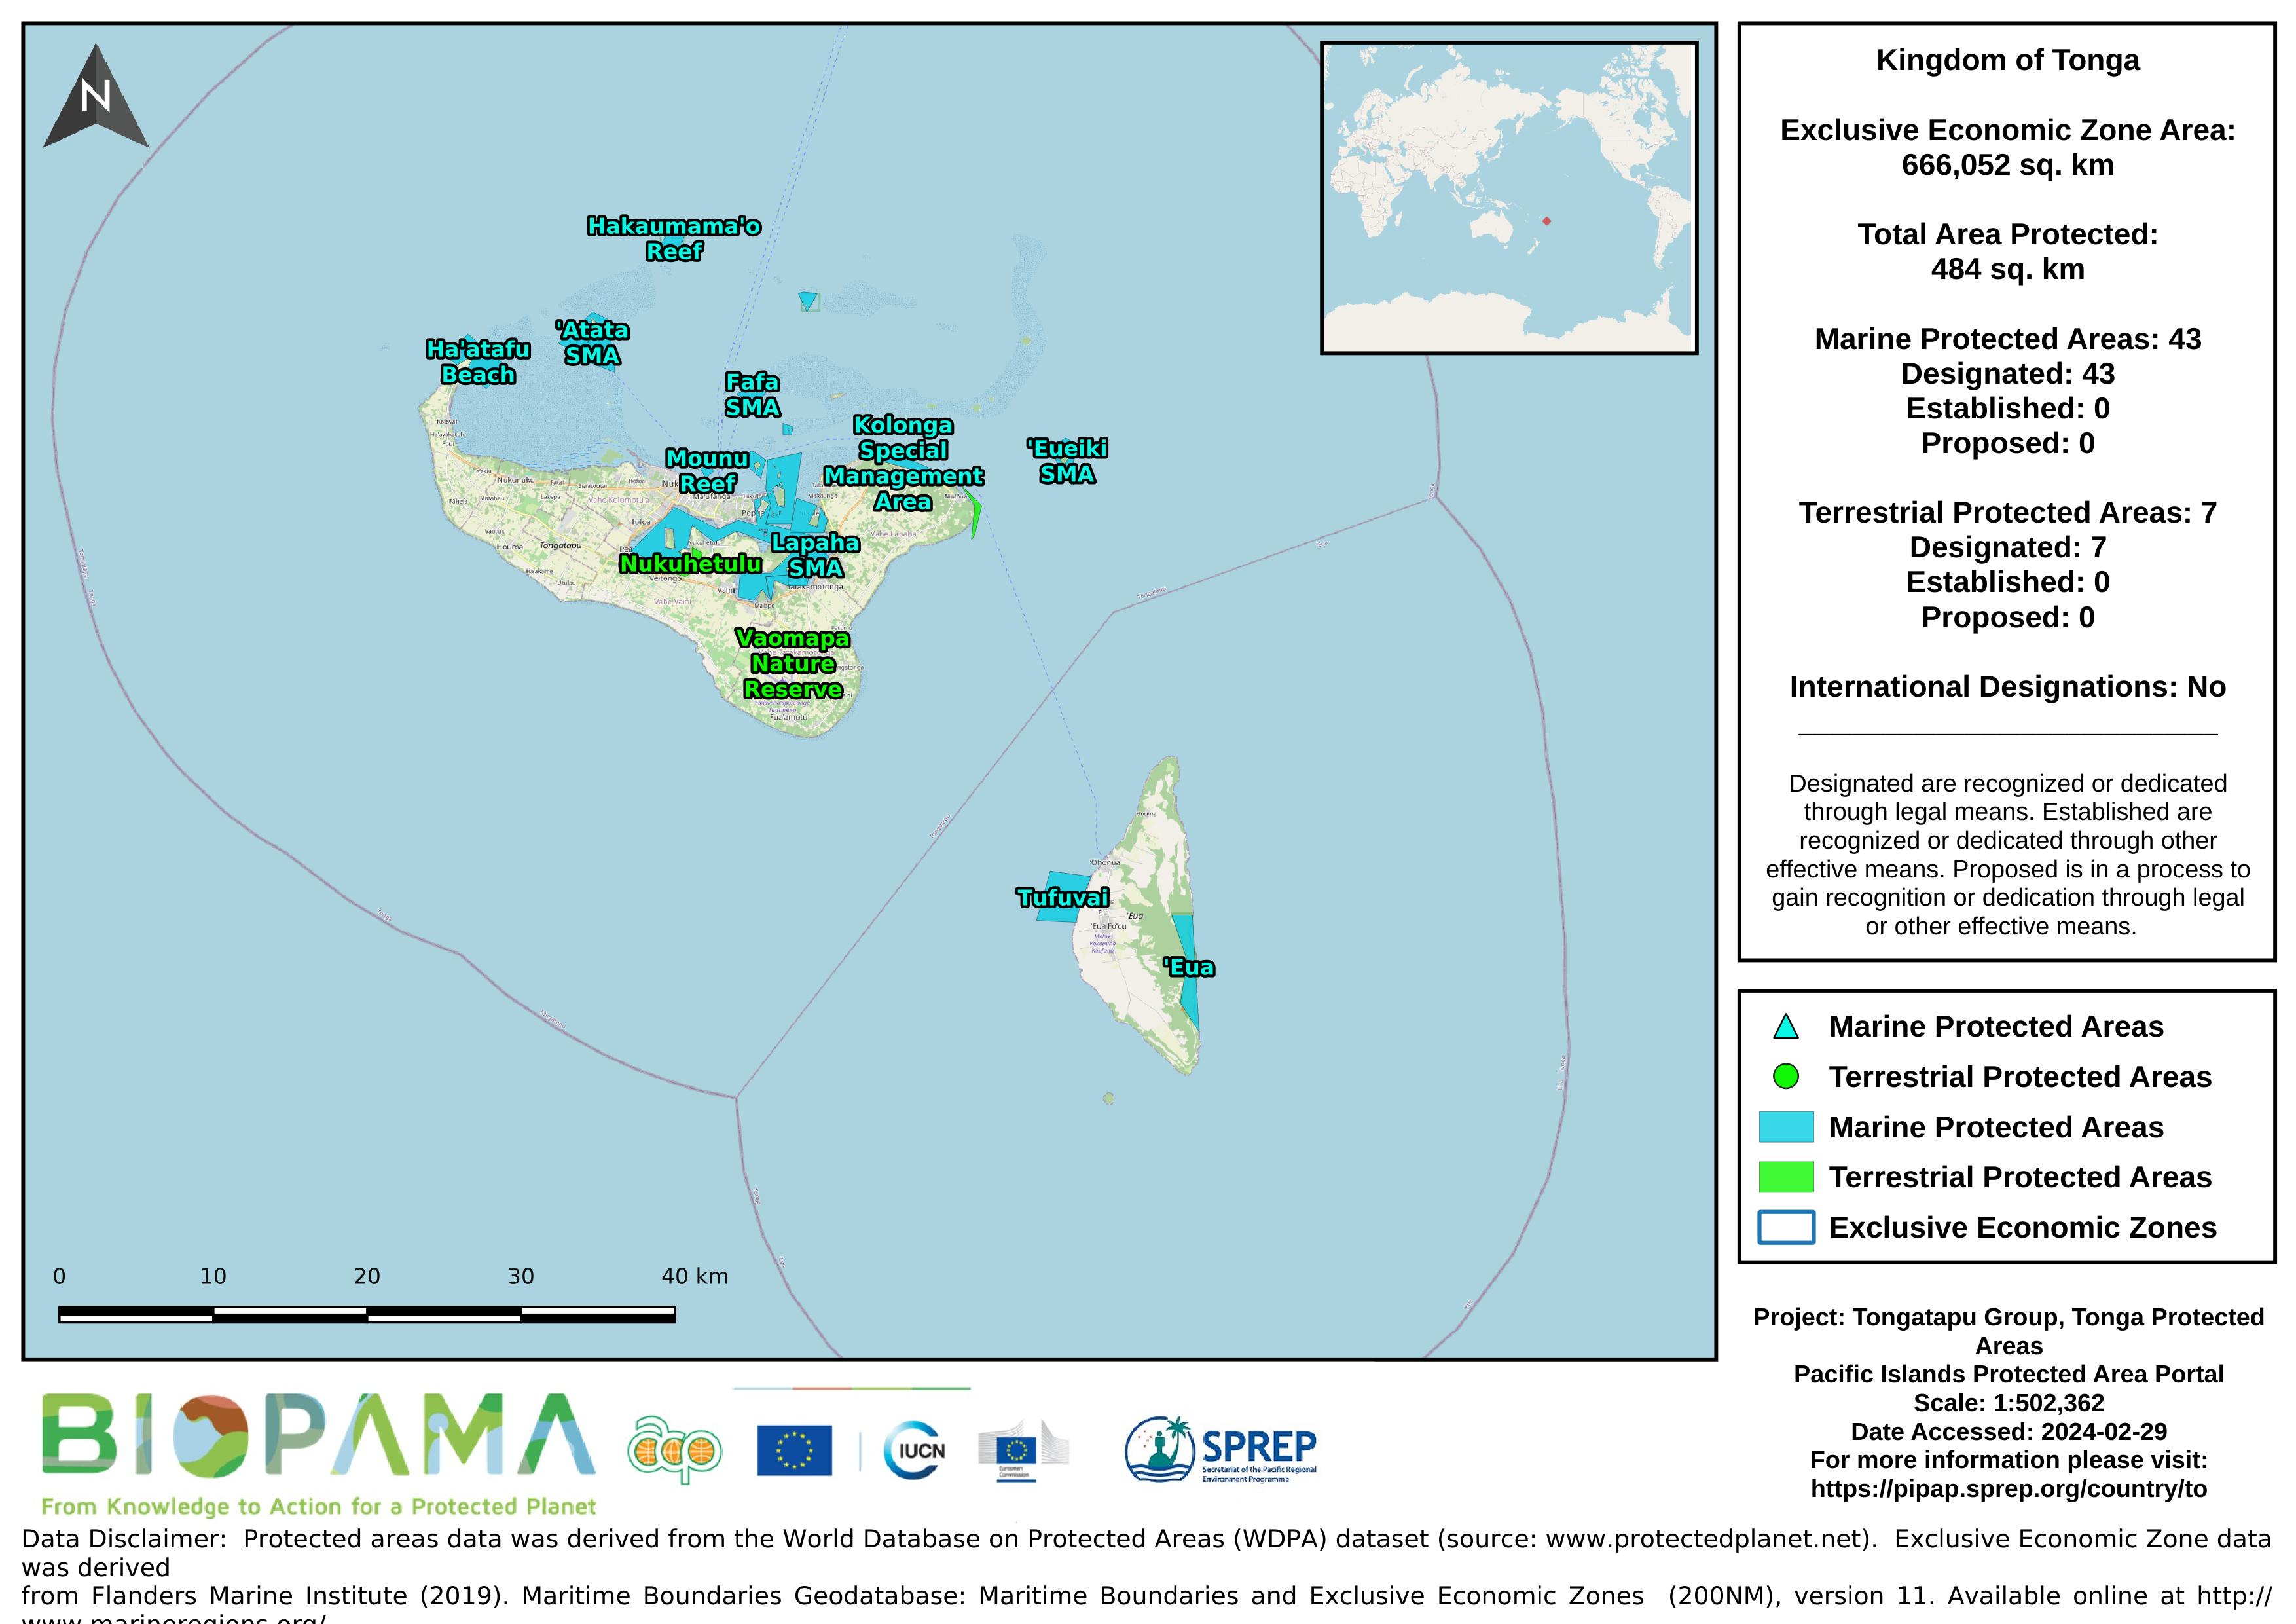
Map of the protected areas for the Tongatapu Group, Tonga with country-level summary statistics on the amount of area under protection, count for each type of protected area (terrestrial or marine), and the count of their designation.
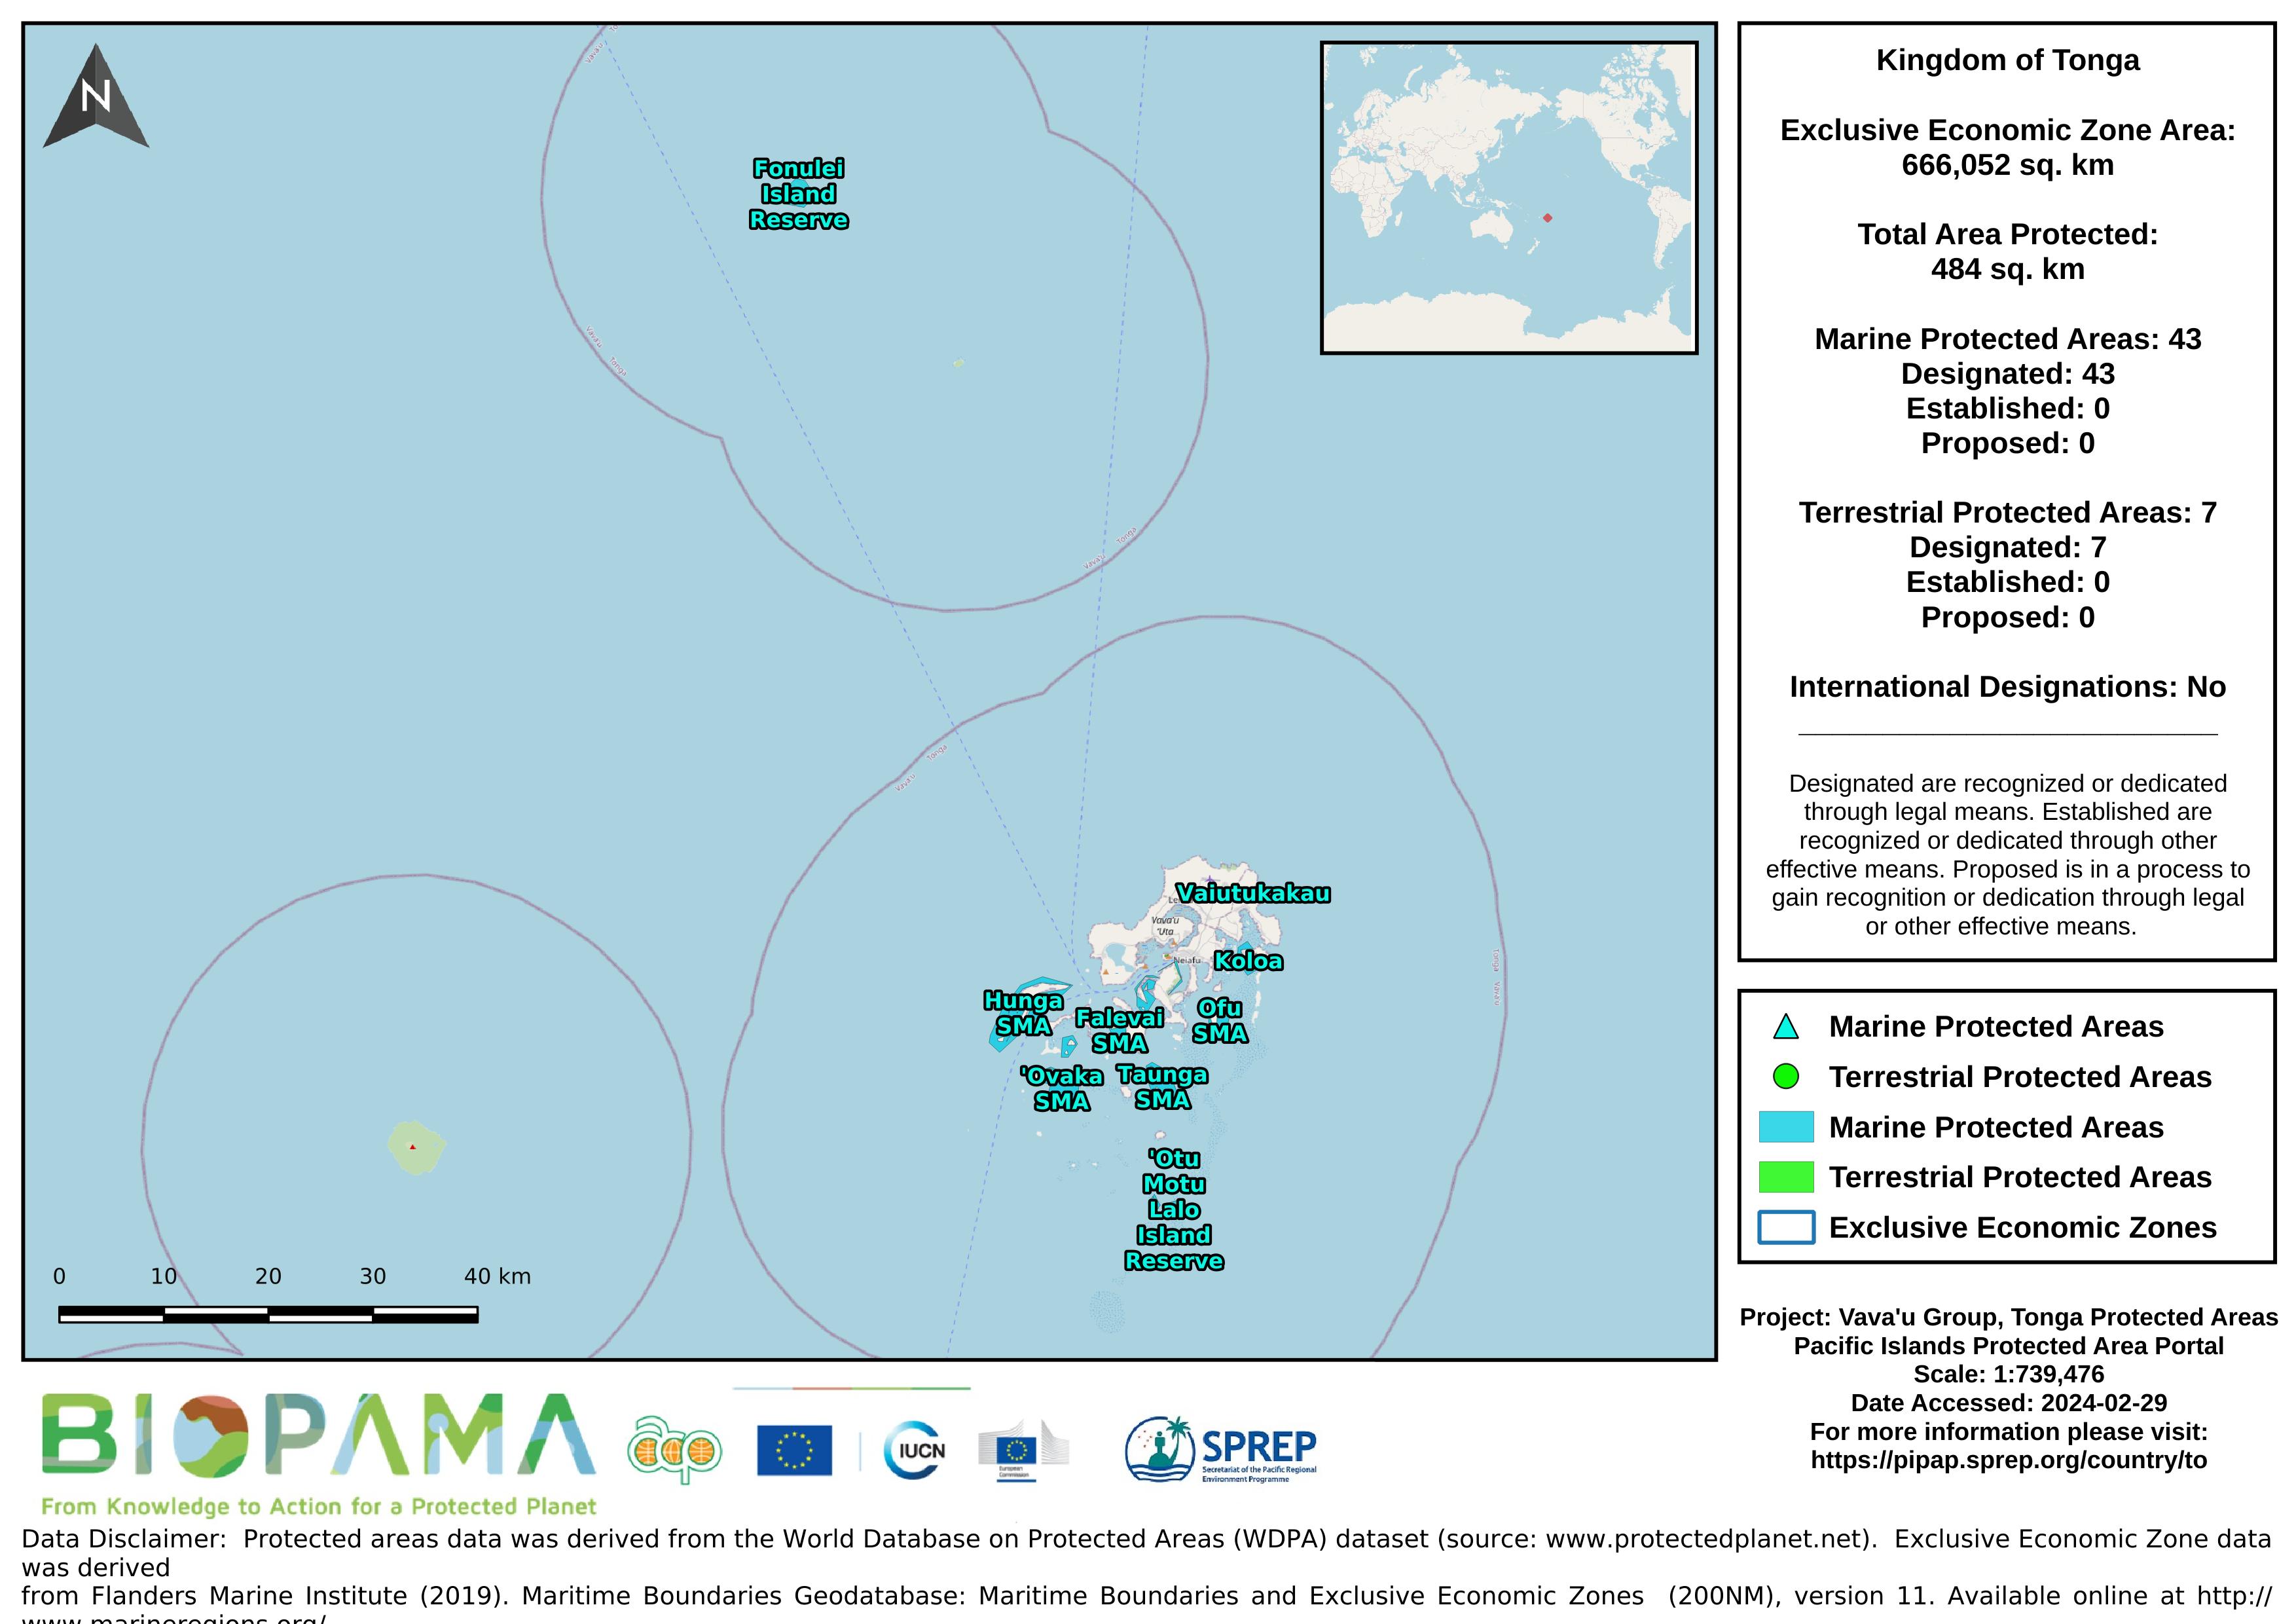
Map of the protected areas for the Vava'u Group, Tonga with country-level summary statistics on the amount of area under protection, count for each type of protected area (terrestrial or marine), and the count of their designation.
The Open Database License (ODbL) is a license agreement intended to
allow users to freely share, modify, and use this Database while
maintaining this same freedom for others. Many databases are covered by
copyright, and therefore this document licenses these rights. Some
jurisdictions, mainly in the European Union, have specific rights that
cover databases, and so the ODbL addresses these rights, too. Finally,
the ODbL is also an agreement in contract for users of this Database to
act in certain ways in return for accessing this Database.
The Institute for Marine Remote Sensing (IMaRS) at the University of South Florida (USF) was funded by the Oceanography Program of the National Aeronautics and Space Administration (NASA) to provide an exhaustive worldwide inventory of coral reefs using high-resolution satellite imagery. By using a consistent dataset of high-resolution (30 meter) multispectral Landsat 7 images acquired between 1999 and 2002, USF characterized, mapped and estimated the extent of shallow coral reef ecosystems in the main coral reef provinces (Caribbean-Atlantic, Pacific, Indo-Pacific, Red Sea).
Raster data representing the mean levels of calcite in µmol/m3 for the surface water layer. The data are available for global-scale applications at a spatial resolution of 5 arcmin (approximately 9.2 km at the equator).
Marine data layers for present conditions were produced with climate data describing monthly averages for the period 2000–2014, obtained from pre-processed global ocean re-analyses combining satellite and in situ observations at regular two- and three-dimensional spatial grids.
Raster data representing the mean levels of current velocities in meters/second for the surface water layer. The data are available for global-scale applications at a spatial resolution of 5 arcmin (approximately 9.2 km at the equator).
Marine data layers for present conditions were produced with climate data describing monthly averages for the period 2000–2014, obtained from pre-processed global ocean re-analyses combining satellite and in situ observations at regular two- and three-dimensional spatial grids.
Raster data representing the mean levels of iron in µmol/m3 for the surface water layer. The data are available for global-scale applications at a spatial resolution of 5 arcmin (approximately 9.2 km at the equator).
Marine data layers for present conditions were produced with climate data describing monthly averages for the period 2000–2014, obtained from pre-processed global ocean re-analyses combining satellite and in situ observations at regular two- and three-dimensional spatial grids.
Raster data representing the mean levels of pH for the surface water layer. The data are available for global-scale applications at a spatial resolution of 5 arcmin (approximately 9.2 km at the equator).
Marine data layers for present conditions were produced with climate data describing monthly averages for the period 2000–2014, obtained from pre-processed global ocean re-analyses combining satellite and in situ observations at regular two- and three-dimensional spatial grids.
Raster data representing the mean levels of photosynthetically active radiation (PAR) in E/m2/year for the surface water layer. The data are available for global-scale applications at a spatial resolution of 5 arcmin (approximately 9.2 km at the equator).
Marine data layers for present conditions were produced with climate data describing monthly averages for the period 2000–2014, obtained from pre-processed global ocean re-analyses combining satellite and in situ observations at regular two- and three-dimensional spatial grids.
From the Turtle Research and Monitoring Database System (TREDS)
From the Turtle Research and Monitoring Database System (TREDS)
From the Turtle Research and Monitoring Database System (TREDS)
From the Turtle Research and Monitoring Database System (TREDS)
From the Turtle Research and Monitoring Database System (TREDS)
From the Turtle Research and Monitoring Database System (TREDS)
The SPREP ID map is a high resolution (1MB) that shows SPREP member countries with their Exclusive Economic Zone (EEZ) boundaries developed by the GIS team at SPREP.
The SPREP ID map is low resolution (200KB) that shows SPREP member countries with their Exclusive Economic Zone (EEZ) boundaries developed by the GIS team at SPREP.