excel file of the different measurements of the various beach lengths in Tonga
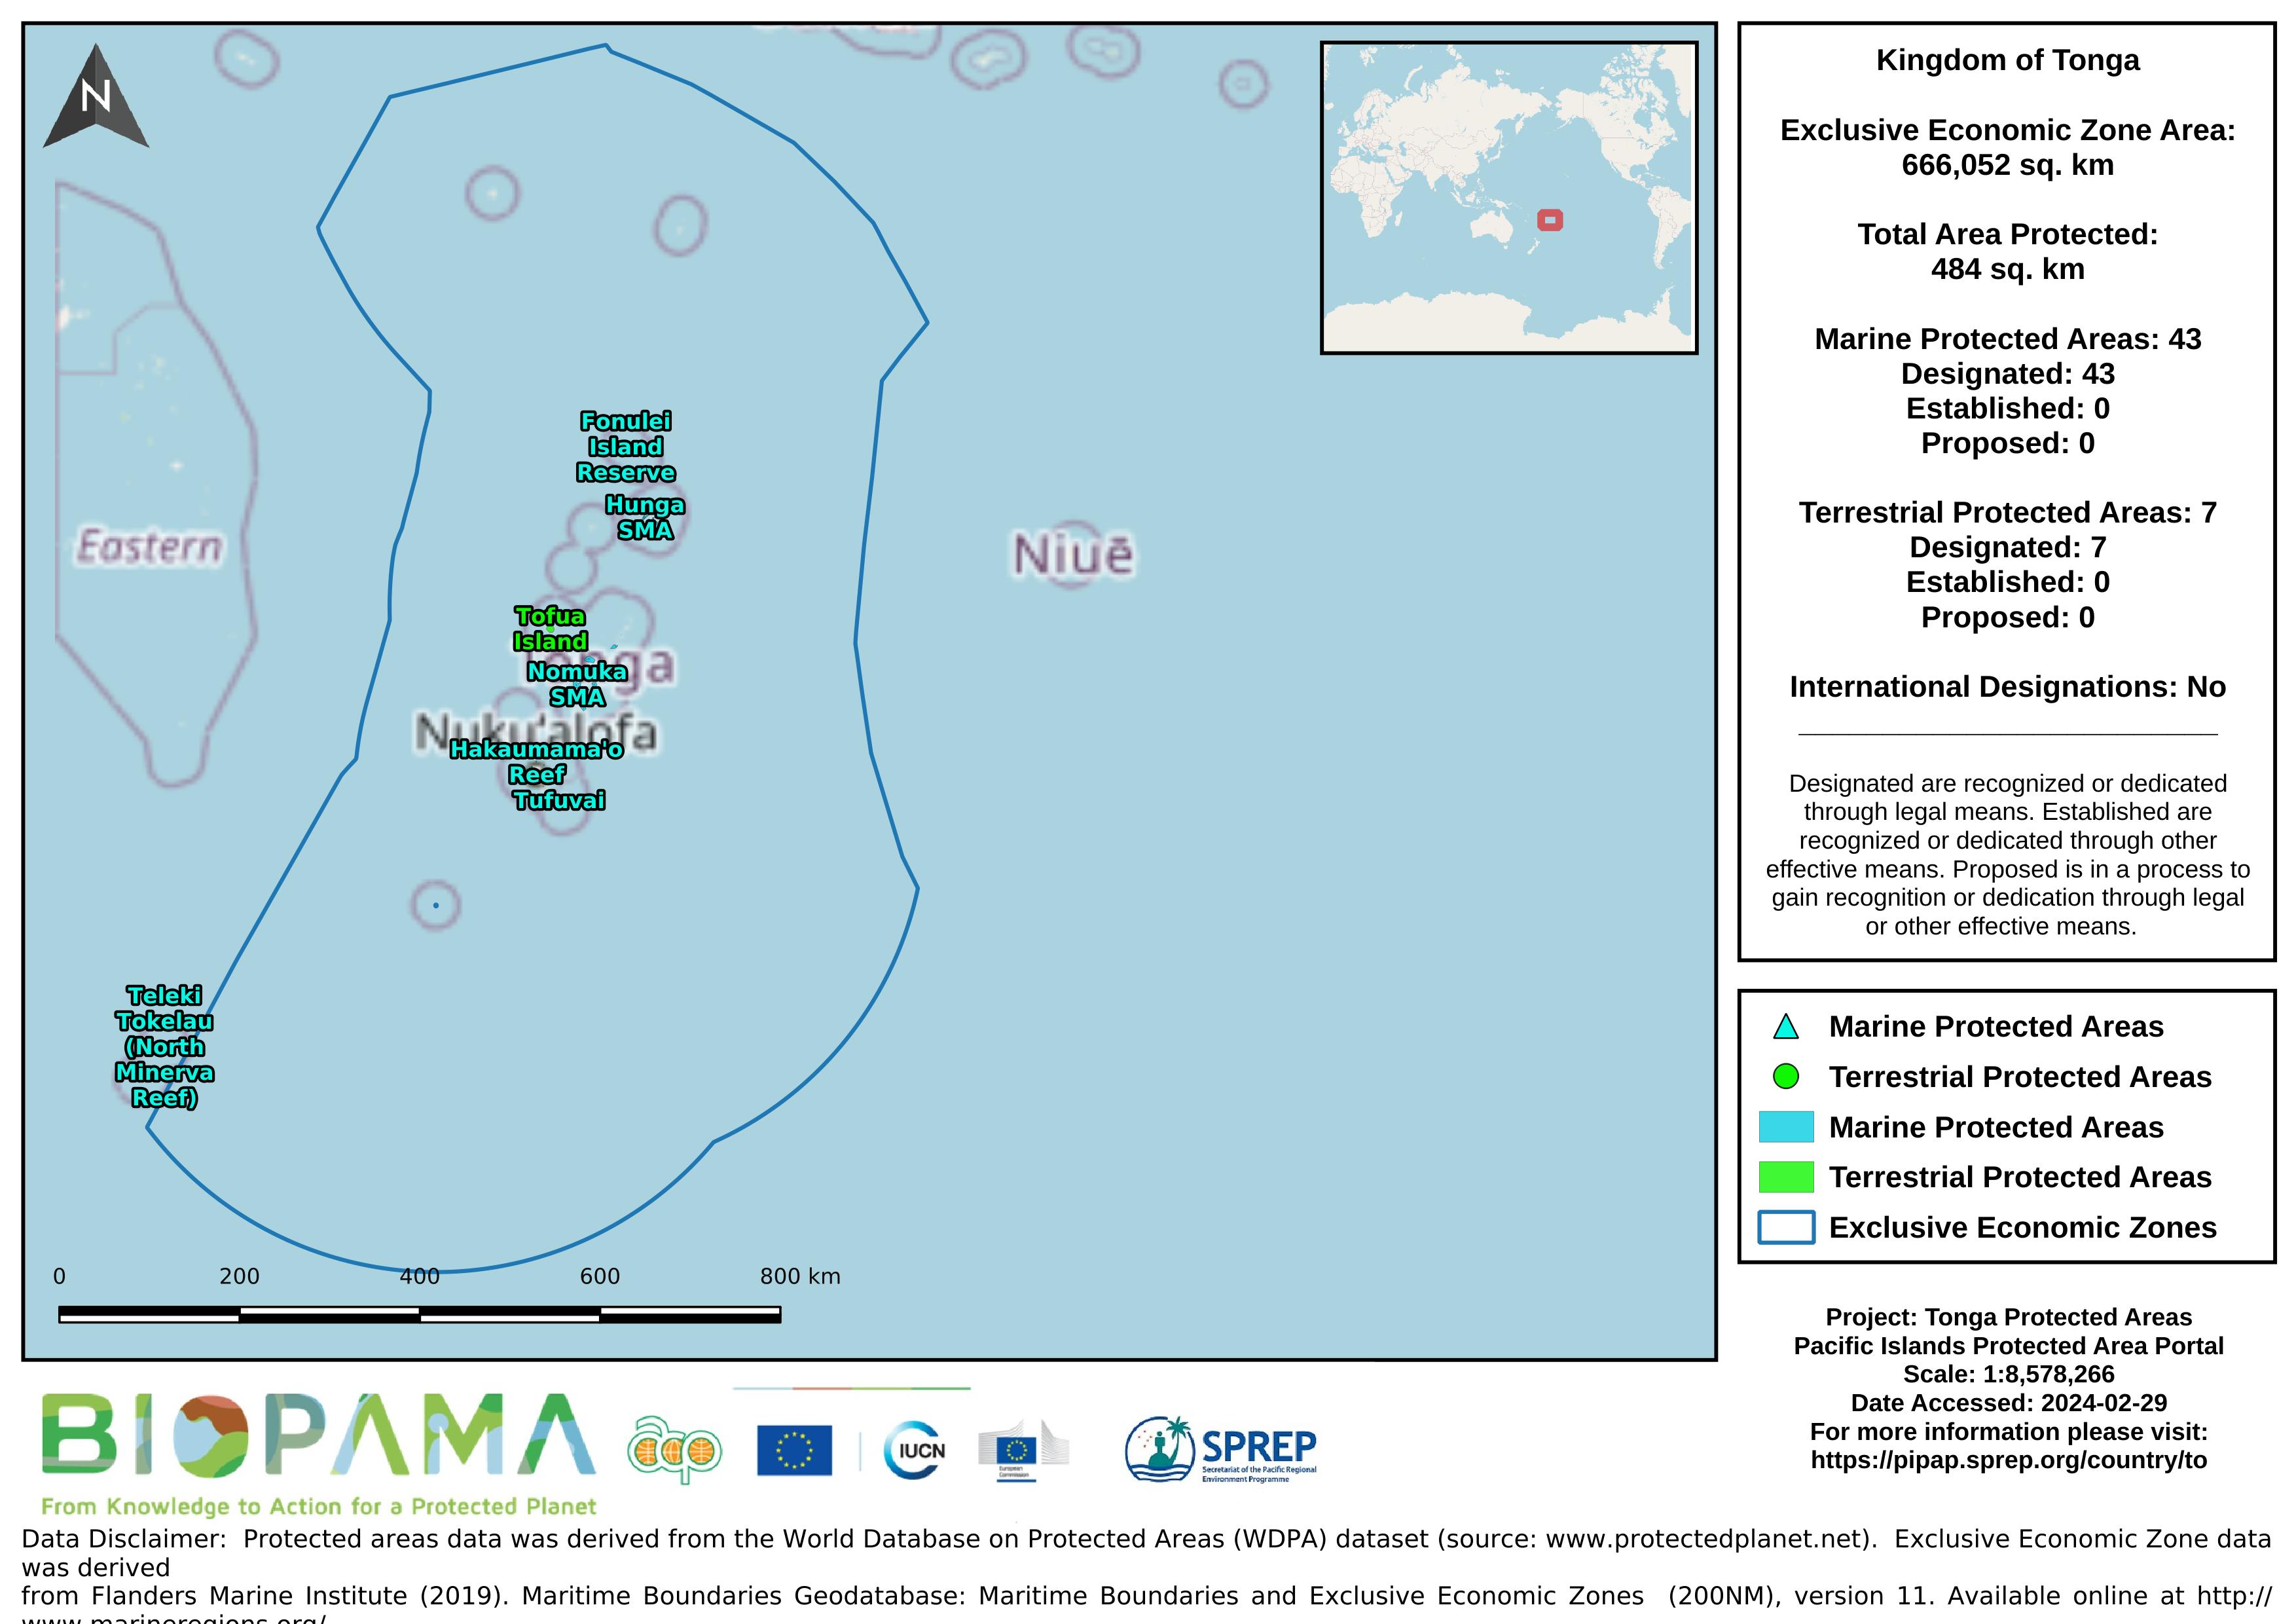
Map of the protected areas for Tonga with country-level summary statistics on the amount of area under protection, count for each type of protected area (terrestrial or marine), and the count of their designation.
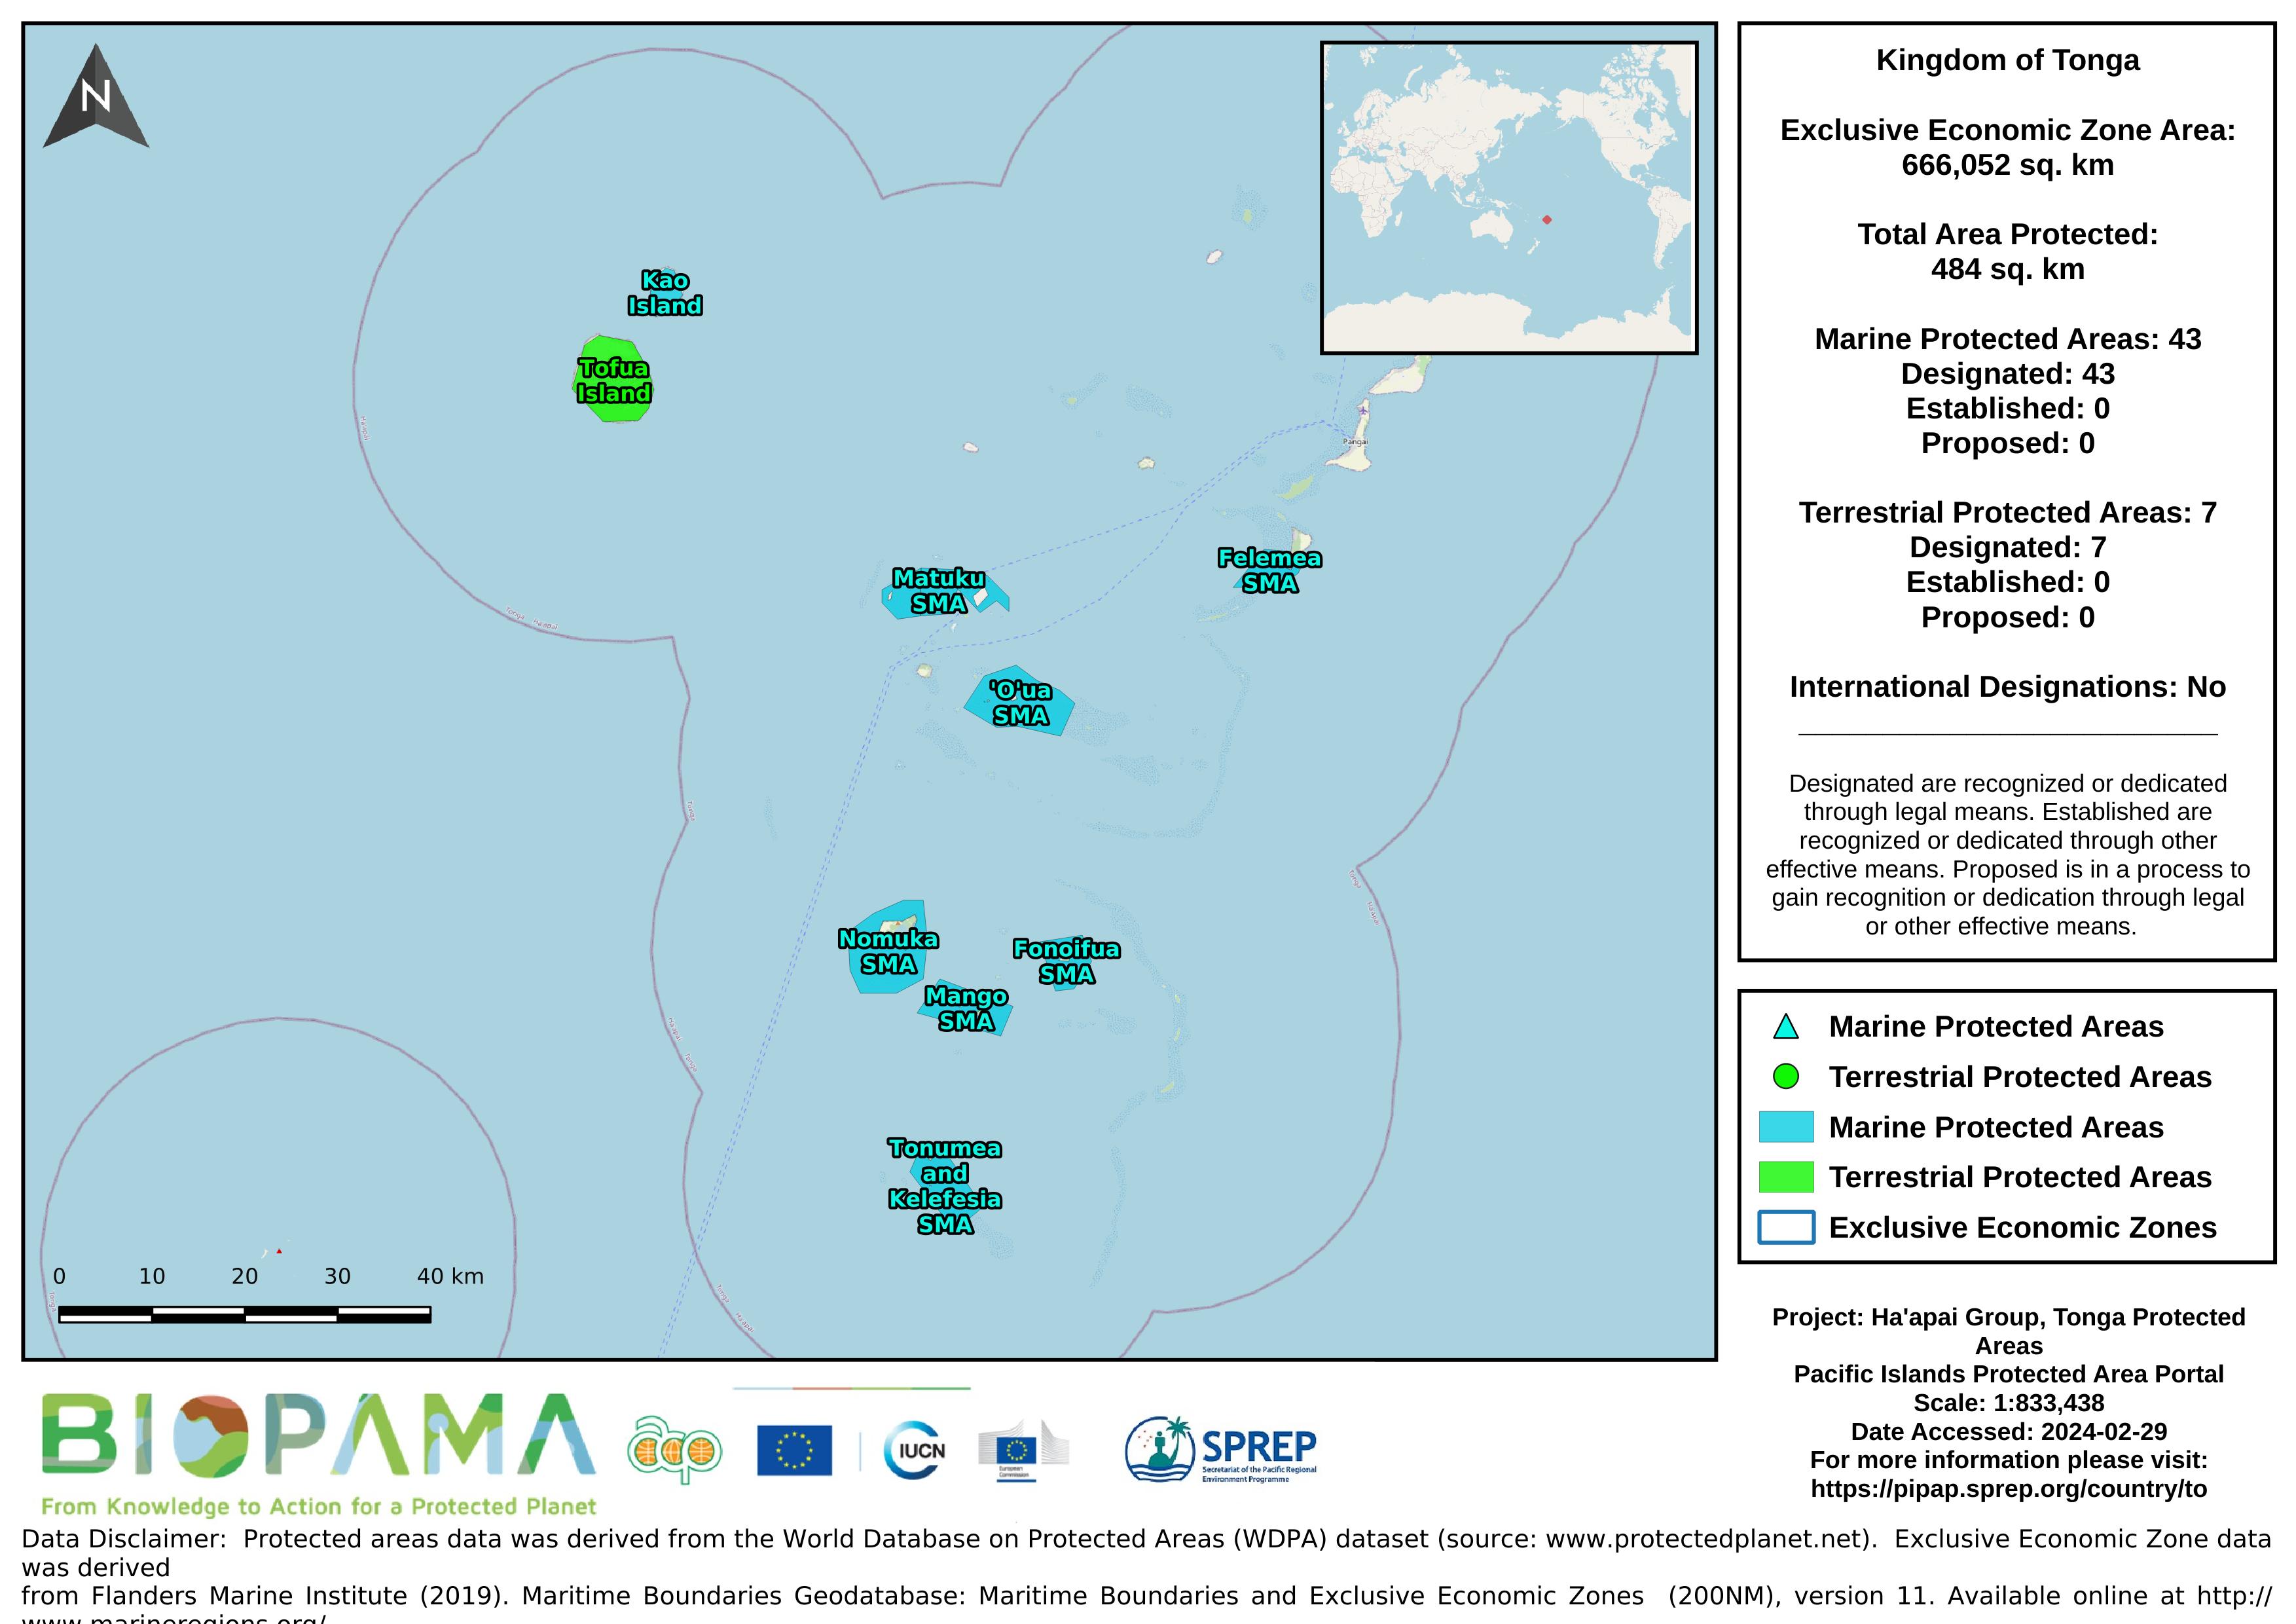
Map of the protected areas for the Ha'apai Group, Tonga with country-level summary statistics on the amount of area under protection, count for each type of protected area (terrestrial or marine), and the count of their designation.
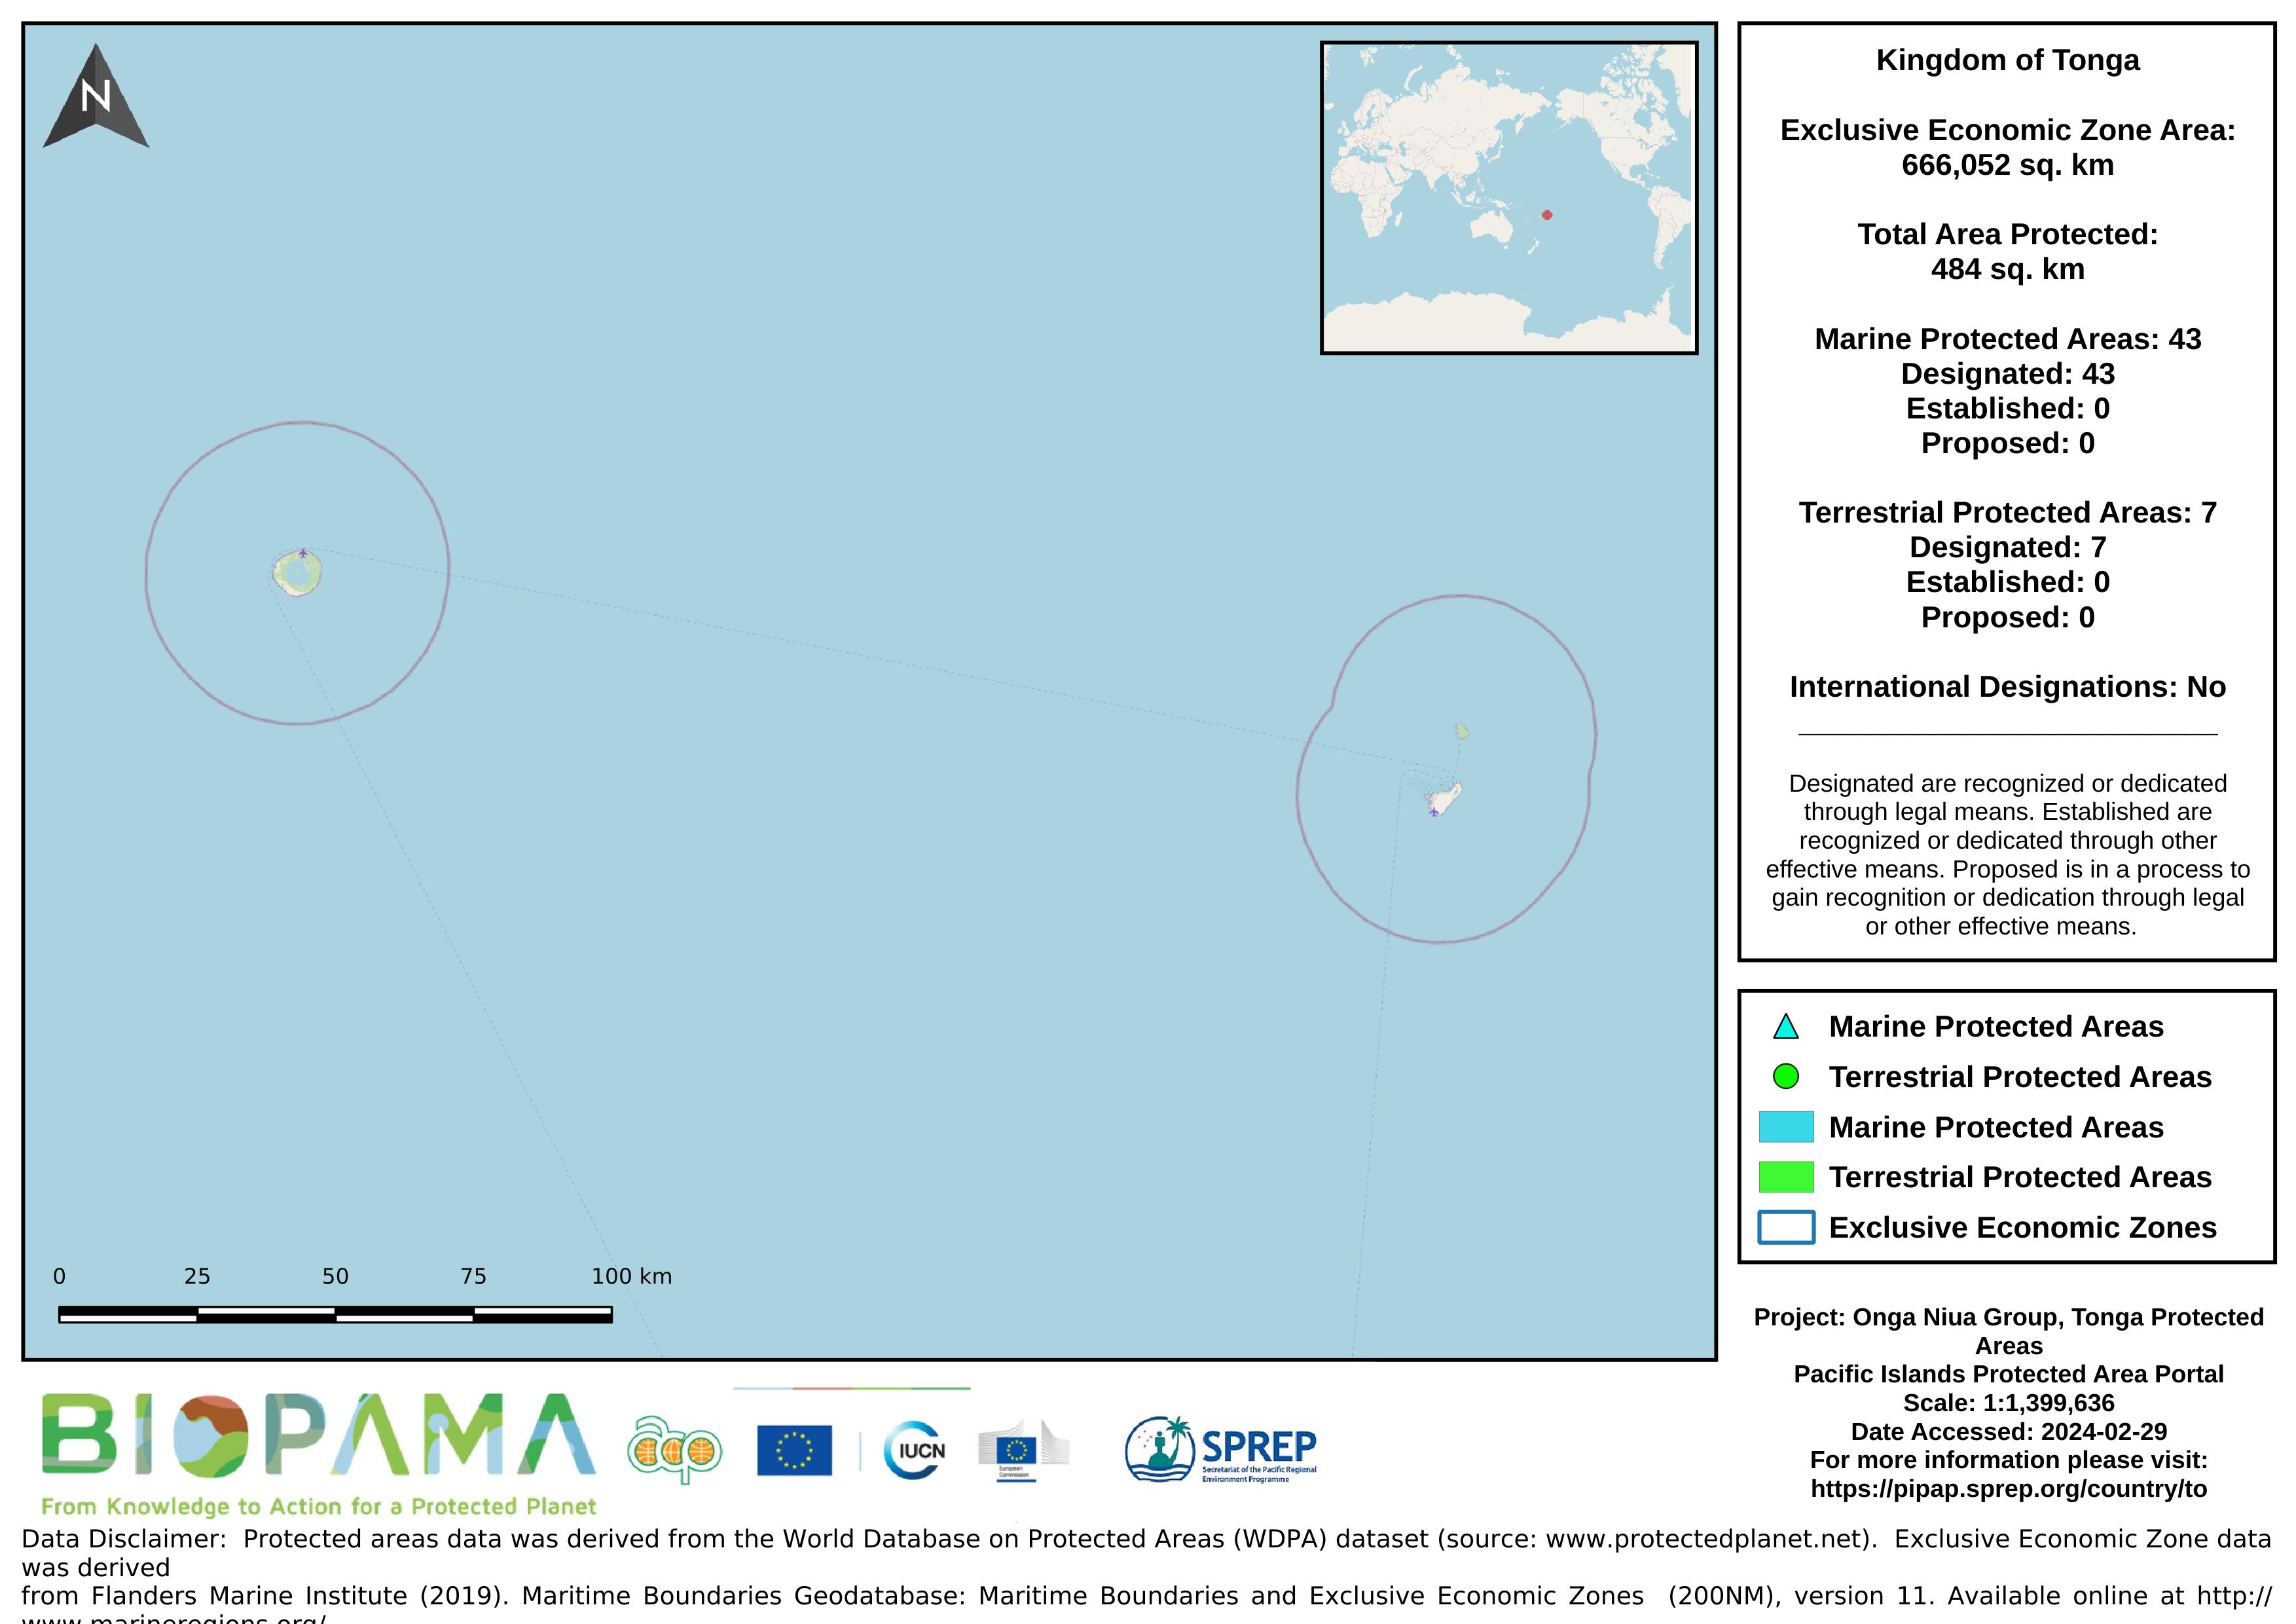
Map of the protected areas for the Niuas Group, Tonga with country-level summary statistics on the amount of area under protection, count for each type of protected area (terrestrial or marine), and the count of their designation.
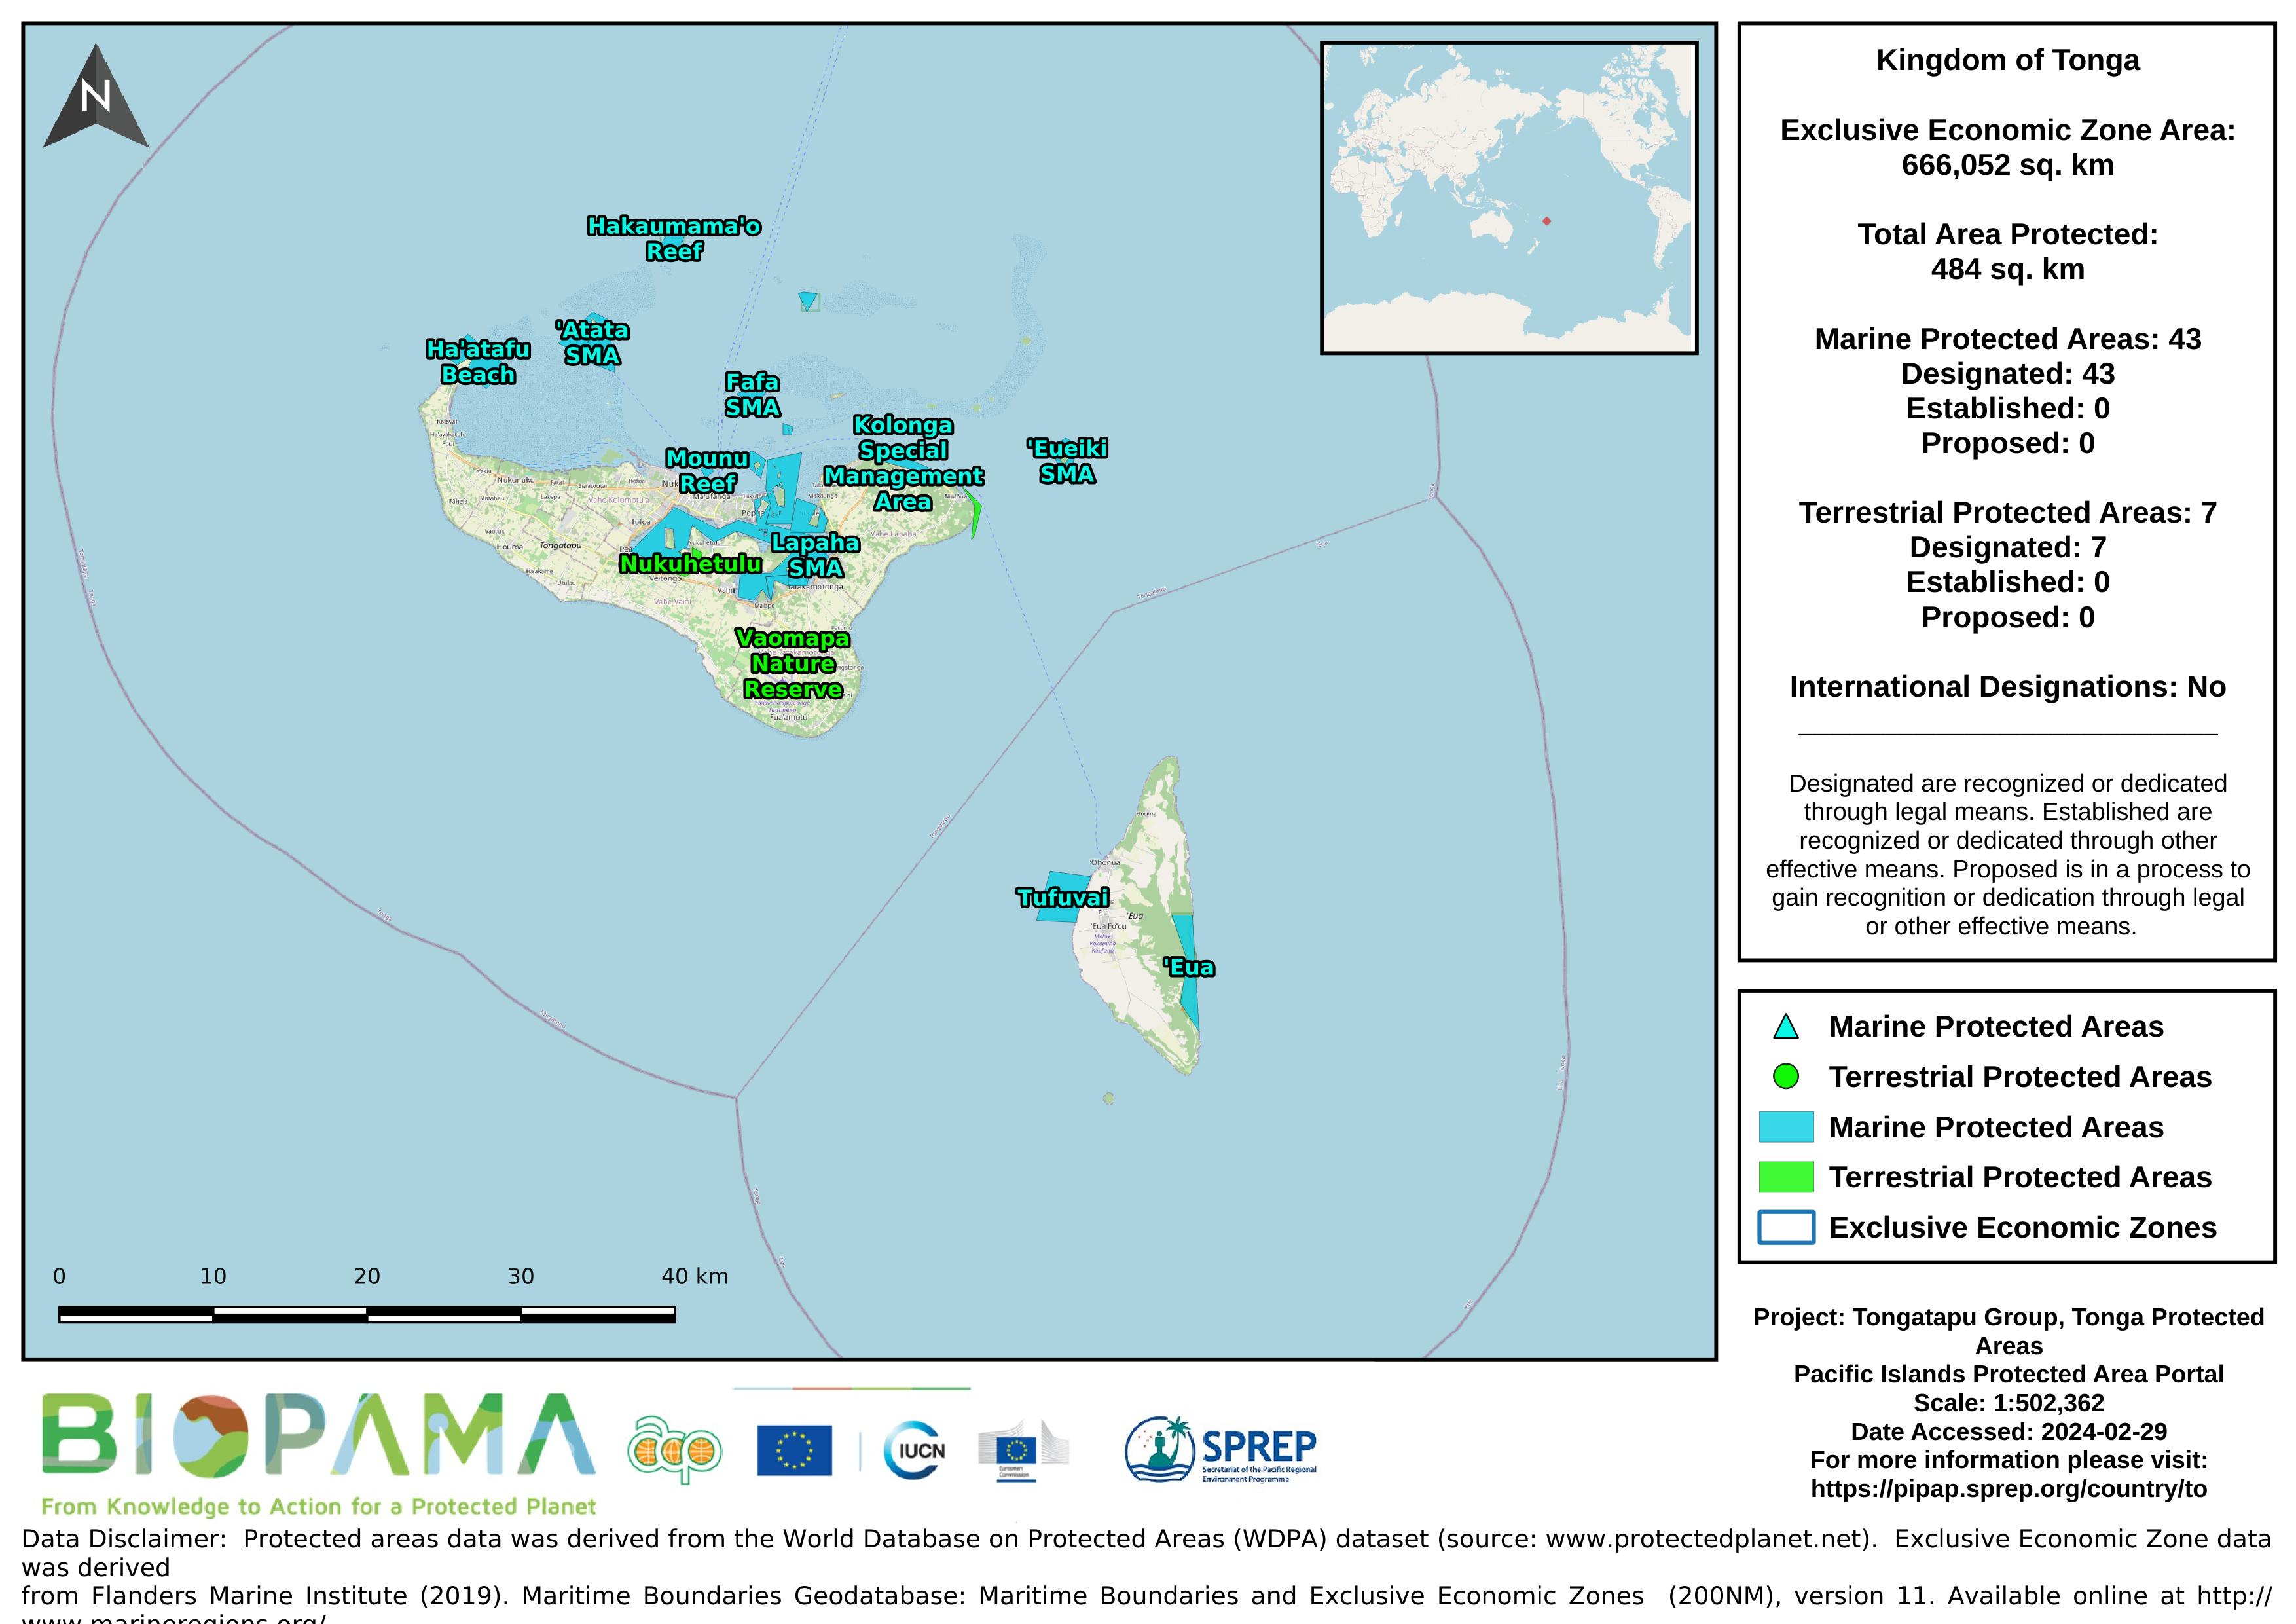
Map of the protected areas for the Tongatapu Group, Tonga with country-level summary statistics on the amount of area under protection, count for each type of protected area (terrestrial or marine), and the count of their designation.
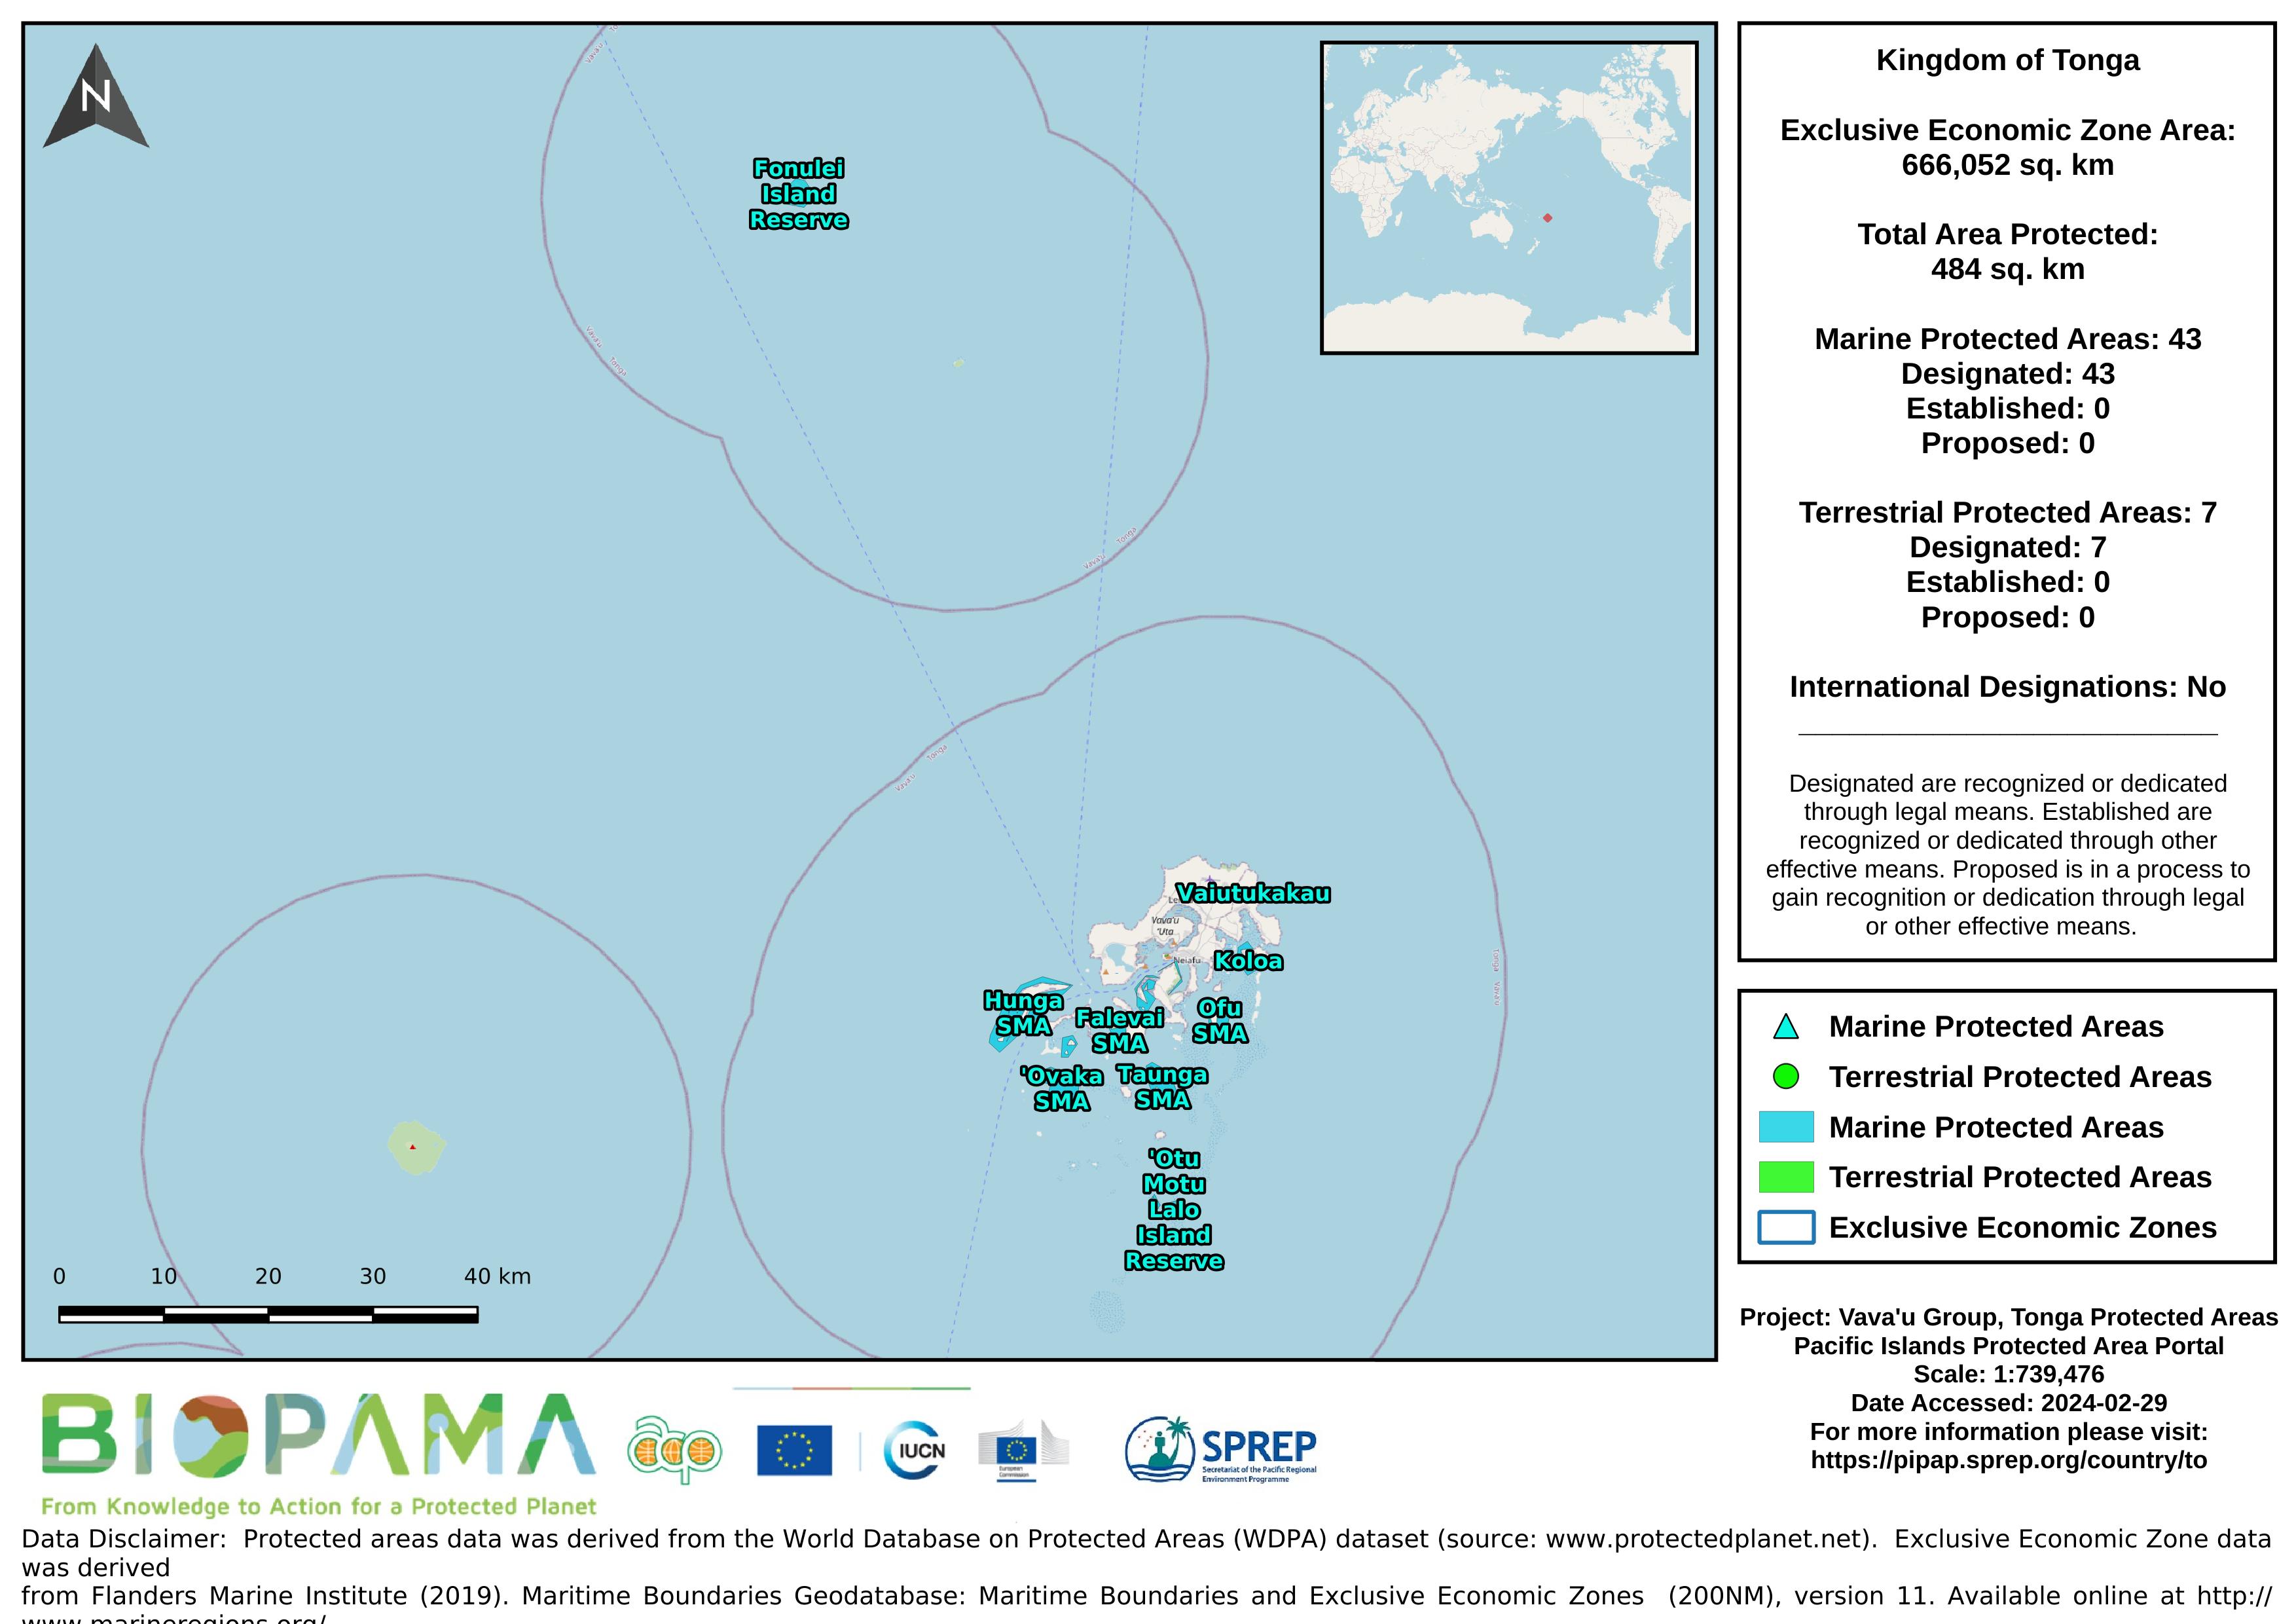
Map of the protected areas for the Vava'u Group, Tonga with country-level summary statistics on the amount of area under protection, count for each type of protected area (terrestrial or marine), and the count of their designation.
The World Database on Protected Areas (WDPA) is the most comprehensive global database of marine and terrestrial protected areas, updated on a monthly basis, and is one of the key global biodiversity data sets being widely used by scientists, businesses, governments, International secretariats and others to inform planning, policy decisions and management.
Marine waste from Pacific Island Countries
The map shows landcover and vegetation impact of the Hunga Tonga Hunga Haápai volcanic eruption on the Tonga Island group.
The maps highlights areas with significant shift in the shoreline by overlaying shoreline data from Nov 2021 and January 2022
The maps highlights areas with significant shift in the shoreline by overlaying shoreline data from Nov 2021 and January 2022
CVS version of the data in excel