The Global Mangrove Watch (GMW) is a collaboration between Aberystwyth University (U.K.), solo Earth Observation (soloEO; Japan), Wetlands International the World Conservation Monitoring Centre (UNEP-WCMC) and the Japan Aerospace Exploration Agency (JAXA).
Conservation International, GRID-Arendal and Geoscience Australia recently collaborated to produce a map of the global distribution of seafloor geomorphic features. The global seafloor geomorphic features map represents an important contribution towards the understanding of the distribution of blue habitats. Certain geomorphic feature are known to be good surrogates for biodiversity. For example, seamounts support a different suite of species to abyssal plains.
A video showing how to use some of the key features of the data portal.
Spreadsheet and graph derived from table 1 of Kingdom of Tonga National Plan of Action (NPOA) Shark-Plan (2014-216)
Time series data and graph of Tonga's deepwater fishery total catch 2006-2016.
Zip file contains a video explaining how to add a dataset for logged-in users
Zip file contains a video explaining how to add additional information for logged-in users.
Zip file contains a video demonstrating a national data portal.
This zip-file contains the setup file to install QGIS software version 3.4, for a 32 bit system.
The increased demand for high quality products in export markets, coupled with Pacific Island Countries (PICs) national desire to protect the environment, biodiversity and family farming structures, lead to assume that organic agriculture could offer good prospects for PICs development. Besides market opportunities, organic agriculture could increase PICs food self-reliance and thus, contribute to reducing the alarming trend of dependency on food imports, as well as improving nutrition.
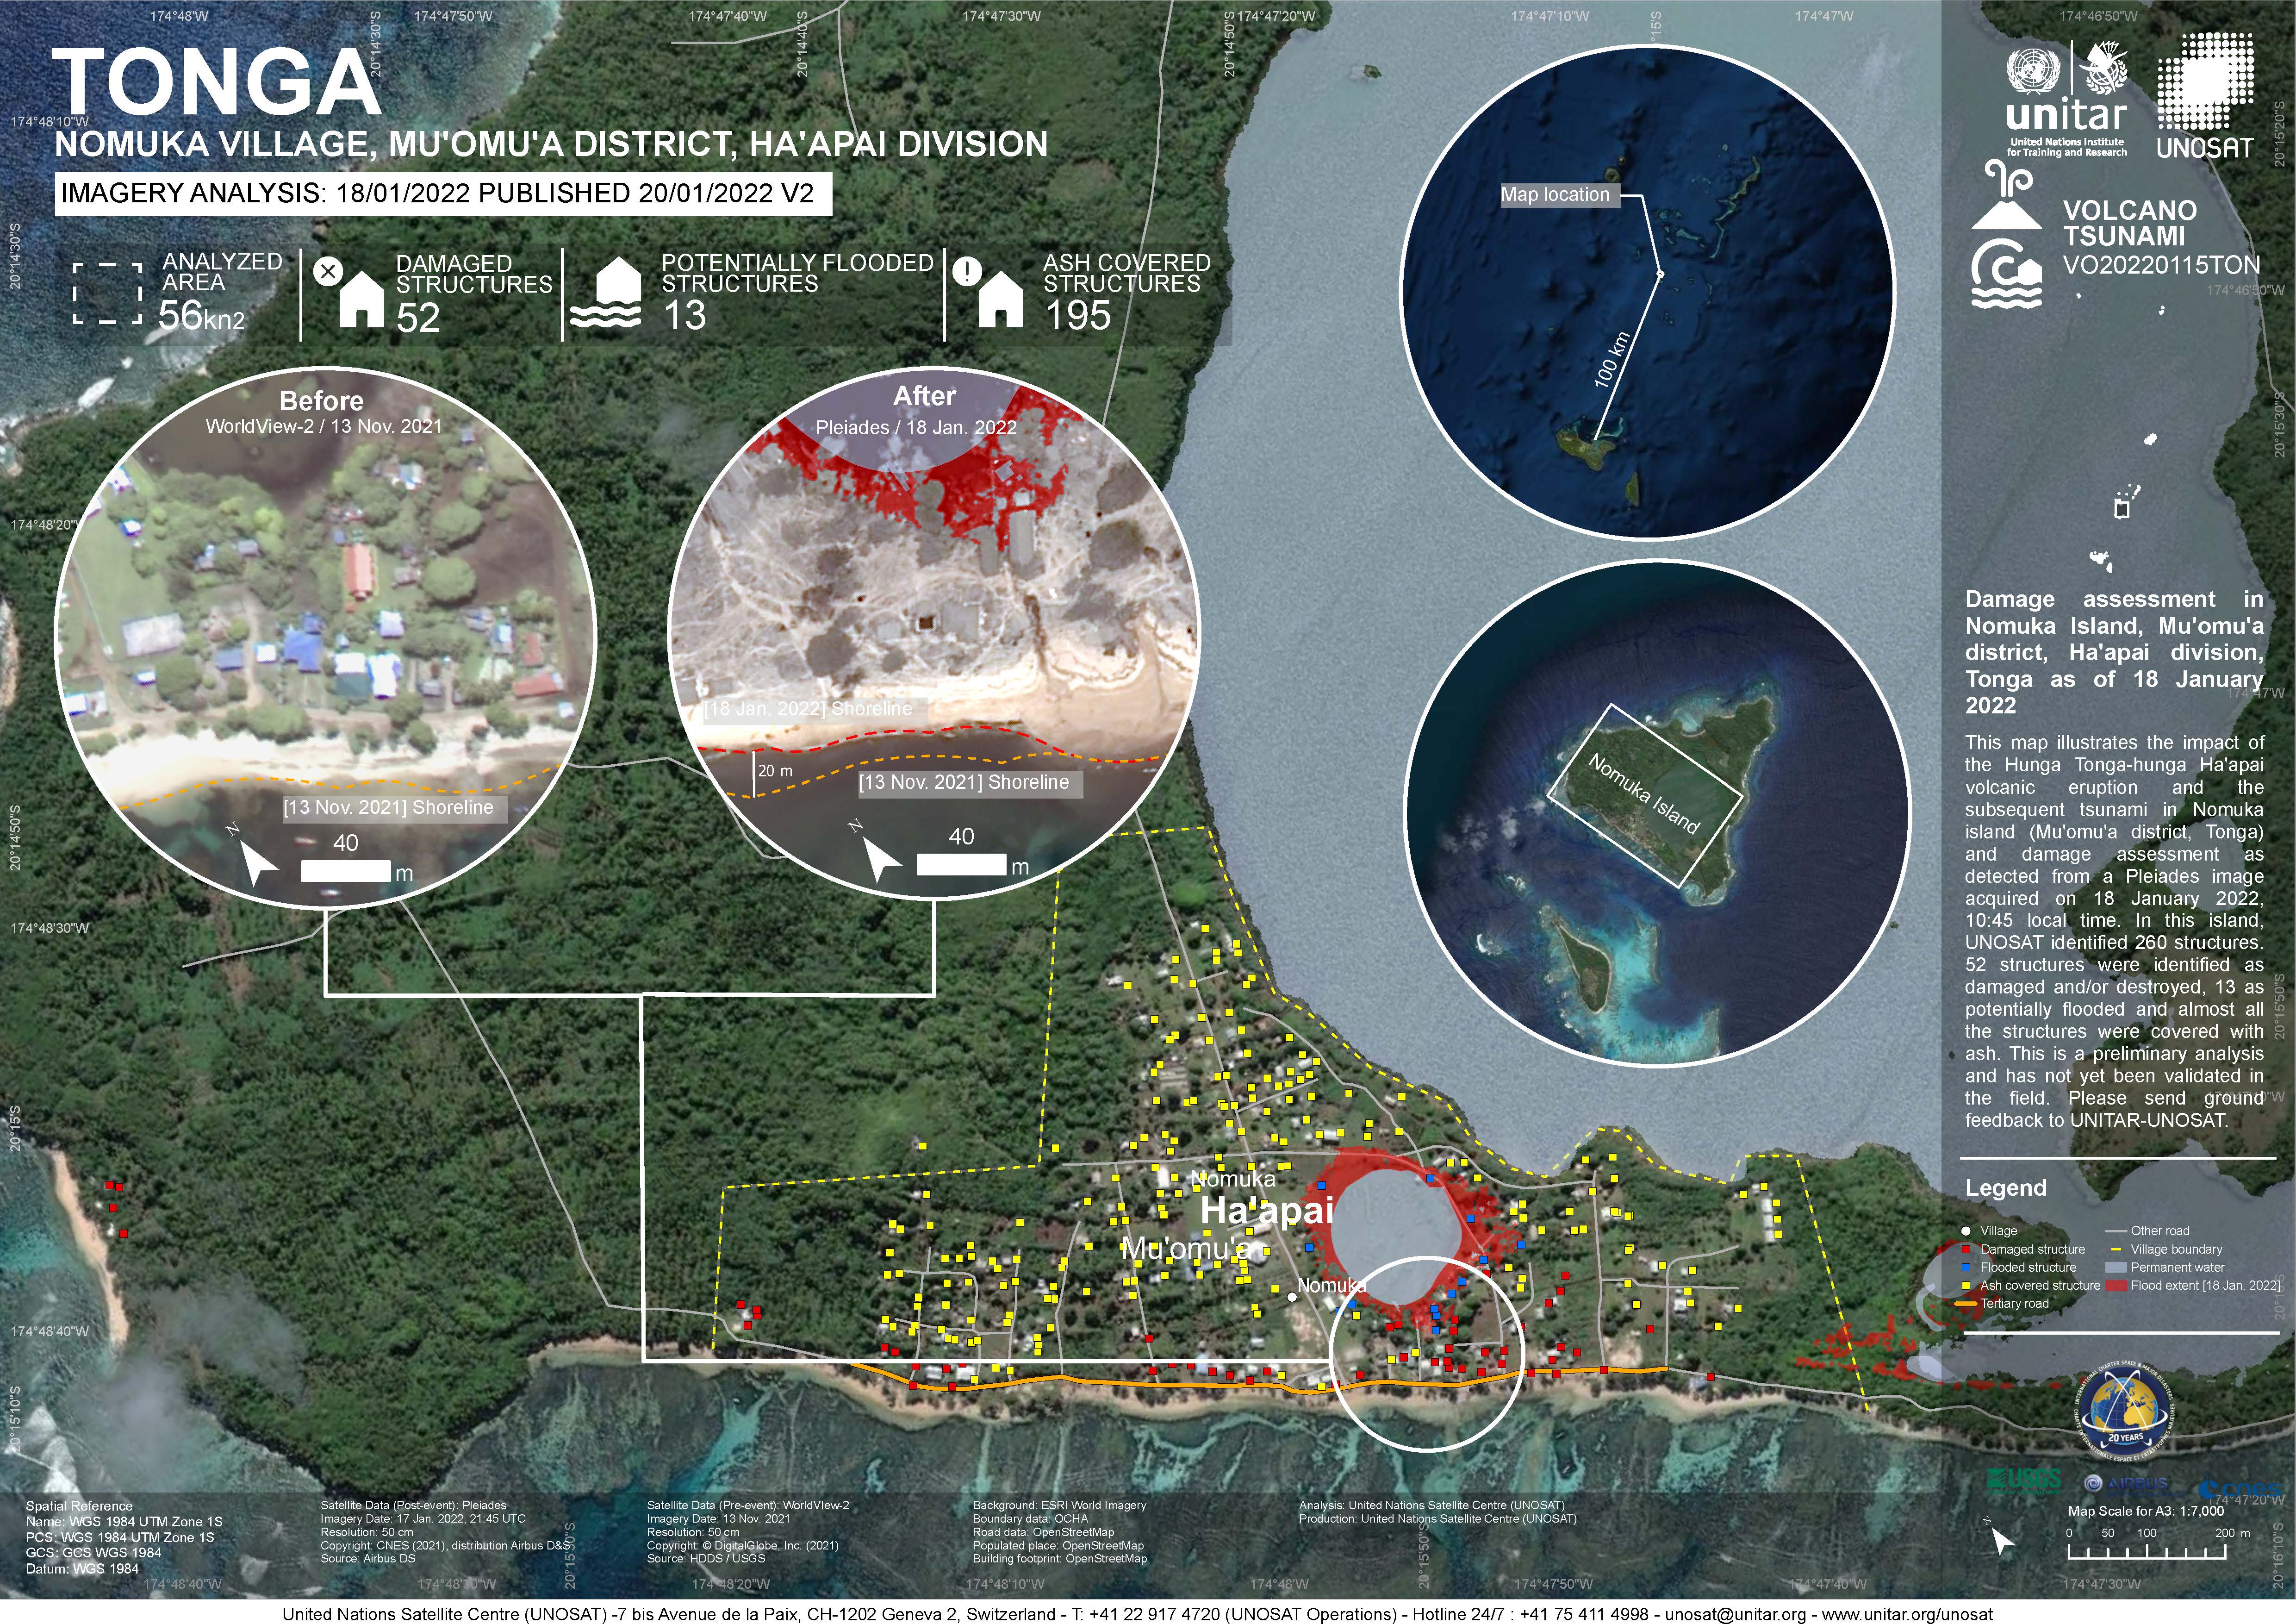
Damage assessment as detected from a Pleiades image acquired on 18 January 2022 in Nomuka Island (Mu'omu'a district, Tonga).
260 structures identified, 52 structures were identified as damaged and/or destroyed, 13 as potentially flooded and almost all structures were covered with ash. This is a preliminary analysis and has not yet been validated in the field
The folder contains GIS data for Atata Island acquired from UNOSTAT. Shapefiles are derived from Pleiades Sensor with data available on Structures impacted Points) and Analysis Extent (Polygon).
The folder contains GIS data for Fonoifua Island acquired from UNOSTAT. Shapefiles are derived from Pleiades Sensor with data available on Structures impacted (Points) and Analysis Extent (Polygon).
The folder contains GIS data for Mango Island acquired from UNOSTAT. Shapefiles are derived from Kompsat3 Sensor, World View 2 Sensor and Pleiades Sensor with data available on Structures impacted (Points), Analysis Extent (Polygon) and Shoreline (Line).
The folder contains GIS data for Nomuka Island acquired from UNOSTAT. Shapefiles are derived from Pleiades Sensor and World View2 sensor with data available on Structures impacted for 17/01, 18/01 (Points), Analysis Extent for 17/01, 18/01 (Polygon), Flood extent, Lake extent (13/11/21 and 18/01/22), Cloud obstruction and SW Shoreline for 13/11/21, 18/01/22.
Buffer distances of 100, 150 and 250km created from the volcanic eruption boundary to identify the level of impacts from the eruption to the resources within the three impact zones.
Map showing reefs with in the different Impact Zones.
This is the Geojson format of the same data in shapefile.