The Gridded Population of the World, Version 4 (GPWv4): Population Density, Revision 11 consists of estimates of human population density (number of persons per square kilometer) based on counts consistent with national censuses and population registers, for the year 2010. A proportional allocation gridding algorithm, utilizing approximately 13.5 million national and sub-national administrative units, was used to assign population counts to 30 arc-second grid cells.
The Gridded Population of the World, Version 4 (GPWv4): Population Density, Revision 11 consists of estimates of human population density (number of persons per square kilometer) based on counts consistent with national censuses and population registers, for the year 2015. A proportional allocation gridding algorithm, utilizing approximately 13.5 million national and sub-national administrative units, was used to assign population counts to 30 arc-second grid cells.
The Gridded Population of the World, Version 4 (GPWv4): Population Density, Revision 11 consists of estimates of human population density (number of persons per square kilometer) based on counts consistent with national censuses and population registers, for the year 2020. A proportional allocation gridding algorithm, utilizing approximately 13.5 million national and sub-national administrative units, was used to assign population counts to 30 arc-second grid cells.
Spreadsheet and graph derived from table 1 of Kingdom of Tonga National Plan of Action (NPOA) Shark-Plan (2014-216)
Time series data and graph of Tonga's deepwater fishery total catch 2006-2016.
The increased demand for high quality products in export markets, coupled with Pacific Island Countries (PICs) national desire to protect the environment, biodiversity and family farming structures, lead to assume that organic agriculture could offer good prospects for PICs development. Besides market opportunities, organic agriculture could increase PICs food self-reliance and thus, contribute to reducing the alarming trend of dependency on food imports, as well as improving nutrition.
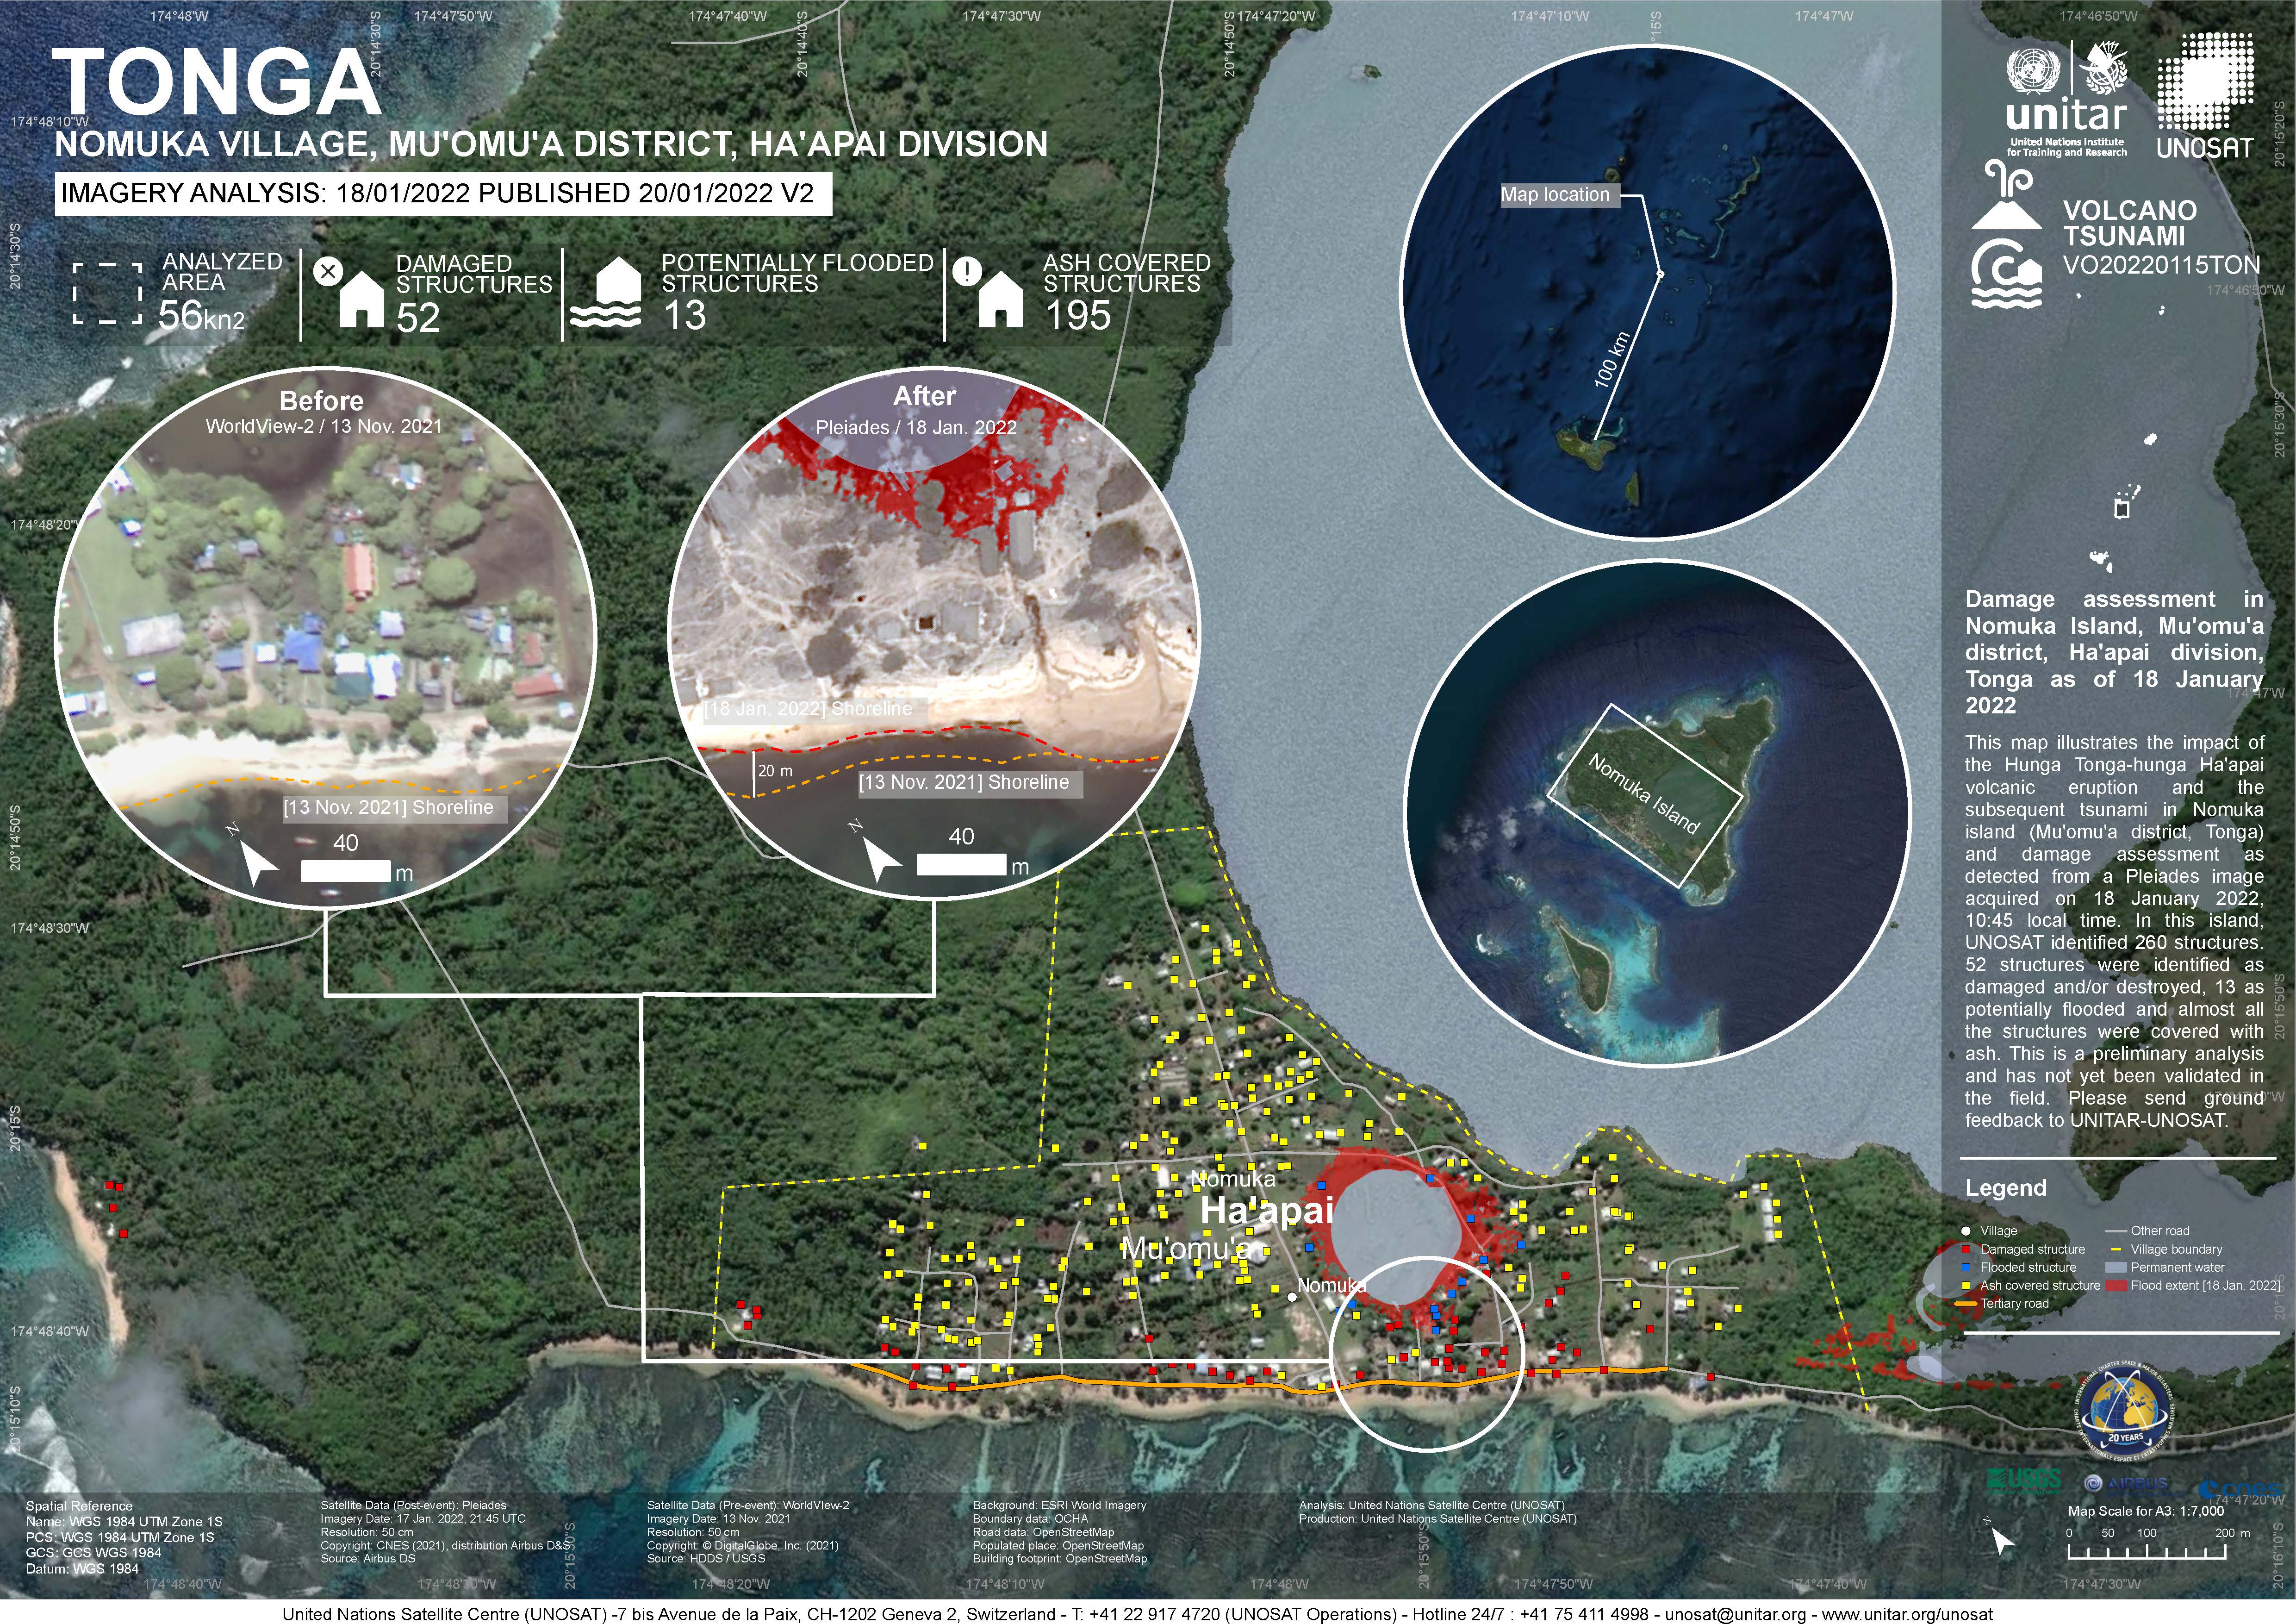
Damage assessment as detected from a Pleiades image acquired on 18 January 2022 in Nomuka Island (Mu'omu'a district, Tonga).
260 structures identified, 52 structures were identified as damaged and/or destroyed, 13 as potentially flooded and almost all structures were covered with ash. This is a preliminary analysis and has not yet been validated in the field
direct link to species occurrences in Tonga on the GBIF website
Most atoll ecosystems and a wide range of terrestrial and marine organisms, and genetic or cultivars varieties of
traditional food and other multi-purpose plants are declining in abundance and under threat of either “economic extinction” or extirpation and in need of some form of protection. The severity of the situation is greatest on those more urbanized atolls where both the biodiversity and the local knowledge of biodiversity are threatened.
*see R Thanman pdf report for more information*
Terrestrial and marine plants and animals that are rare, endangered or in short supply,
and in need of protection in the atolls of the Pacific Islands.
This excel file include four spreadsheets each representing a separate theme (EMG = Environmental Monitoring and Governance, IOE = Island and Ocean Ecosystems, CCR = Climate Change Resilience, WMPC = waste). Within each theme are the core national environment indicators (scrolling from left to right).
Bio-ORACLE is a set of GIS rasters providing geophysical, biotic and environmental data for surface and benthic marine realms. The data are available for global-scale applications at a spatial resolution of 5 arcmin (approximately 9.2 km at the equator).
Linking biodiversity occurrence data to the physical and biotic environment provides a framework to formulate hypotheses about the ecological processes governing spatial and temporal patterns in biodiversity, which can be useful for marine ecosystem management and conservation.
Reefs at Risk Revisited is a high-resolution update of the original global analysis, Reefs at Risk: A Map-Based Indicator of Threats to the World’s Coral Reefs. Reefs at Risk Revisited uses a global map of coral reefs at 500-m resolution, which is 64 times more detailed than the 4-km resolution map used in the 1998 analysis, and benefits from improvements in many global data sets used to evaluate threats to reefs (most threat data are at 1 km resolution, which is 16 times more detailed than those used in the 1998 analysis).
Metadata file for the GIS data (raster and shapefiles) for the global threats to coral reefs: acidification, future thermal stress, integrated future threats, and past thermal stress.
Metadata file for the GIS data (raster and shapefiles) for the local threats to coral reefs: coastal development, integrated local, marine pollution, overfishing, and watershed pollution.
From the Turtle Research and Monitoring Database System (TREDS)
From the Turtle Research and Monitoring Database System (TREDS)