The increased demand for high quality products in export markets, coupled with Pacific Island Countries (PICs) national desire to protect the environment, biodiversity and family farming structures, lead to assume that organic agriculture could offer good prospects for PICs development. Besides market opportunities, organic agriculture could increase PICs food self-reliance and thus, contribute to reducing the alarming trend of dependency on food imports, as well as improving nutrition.
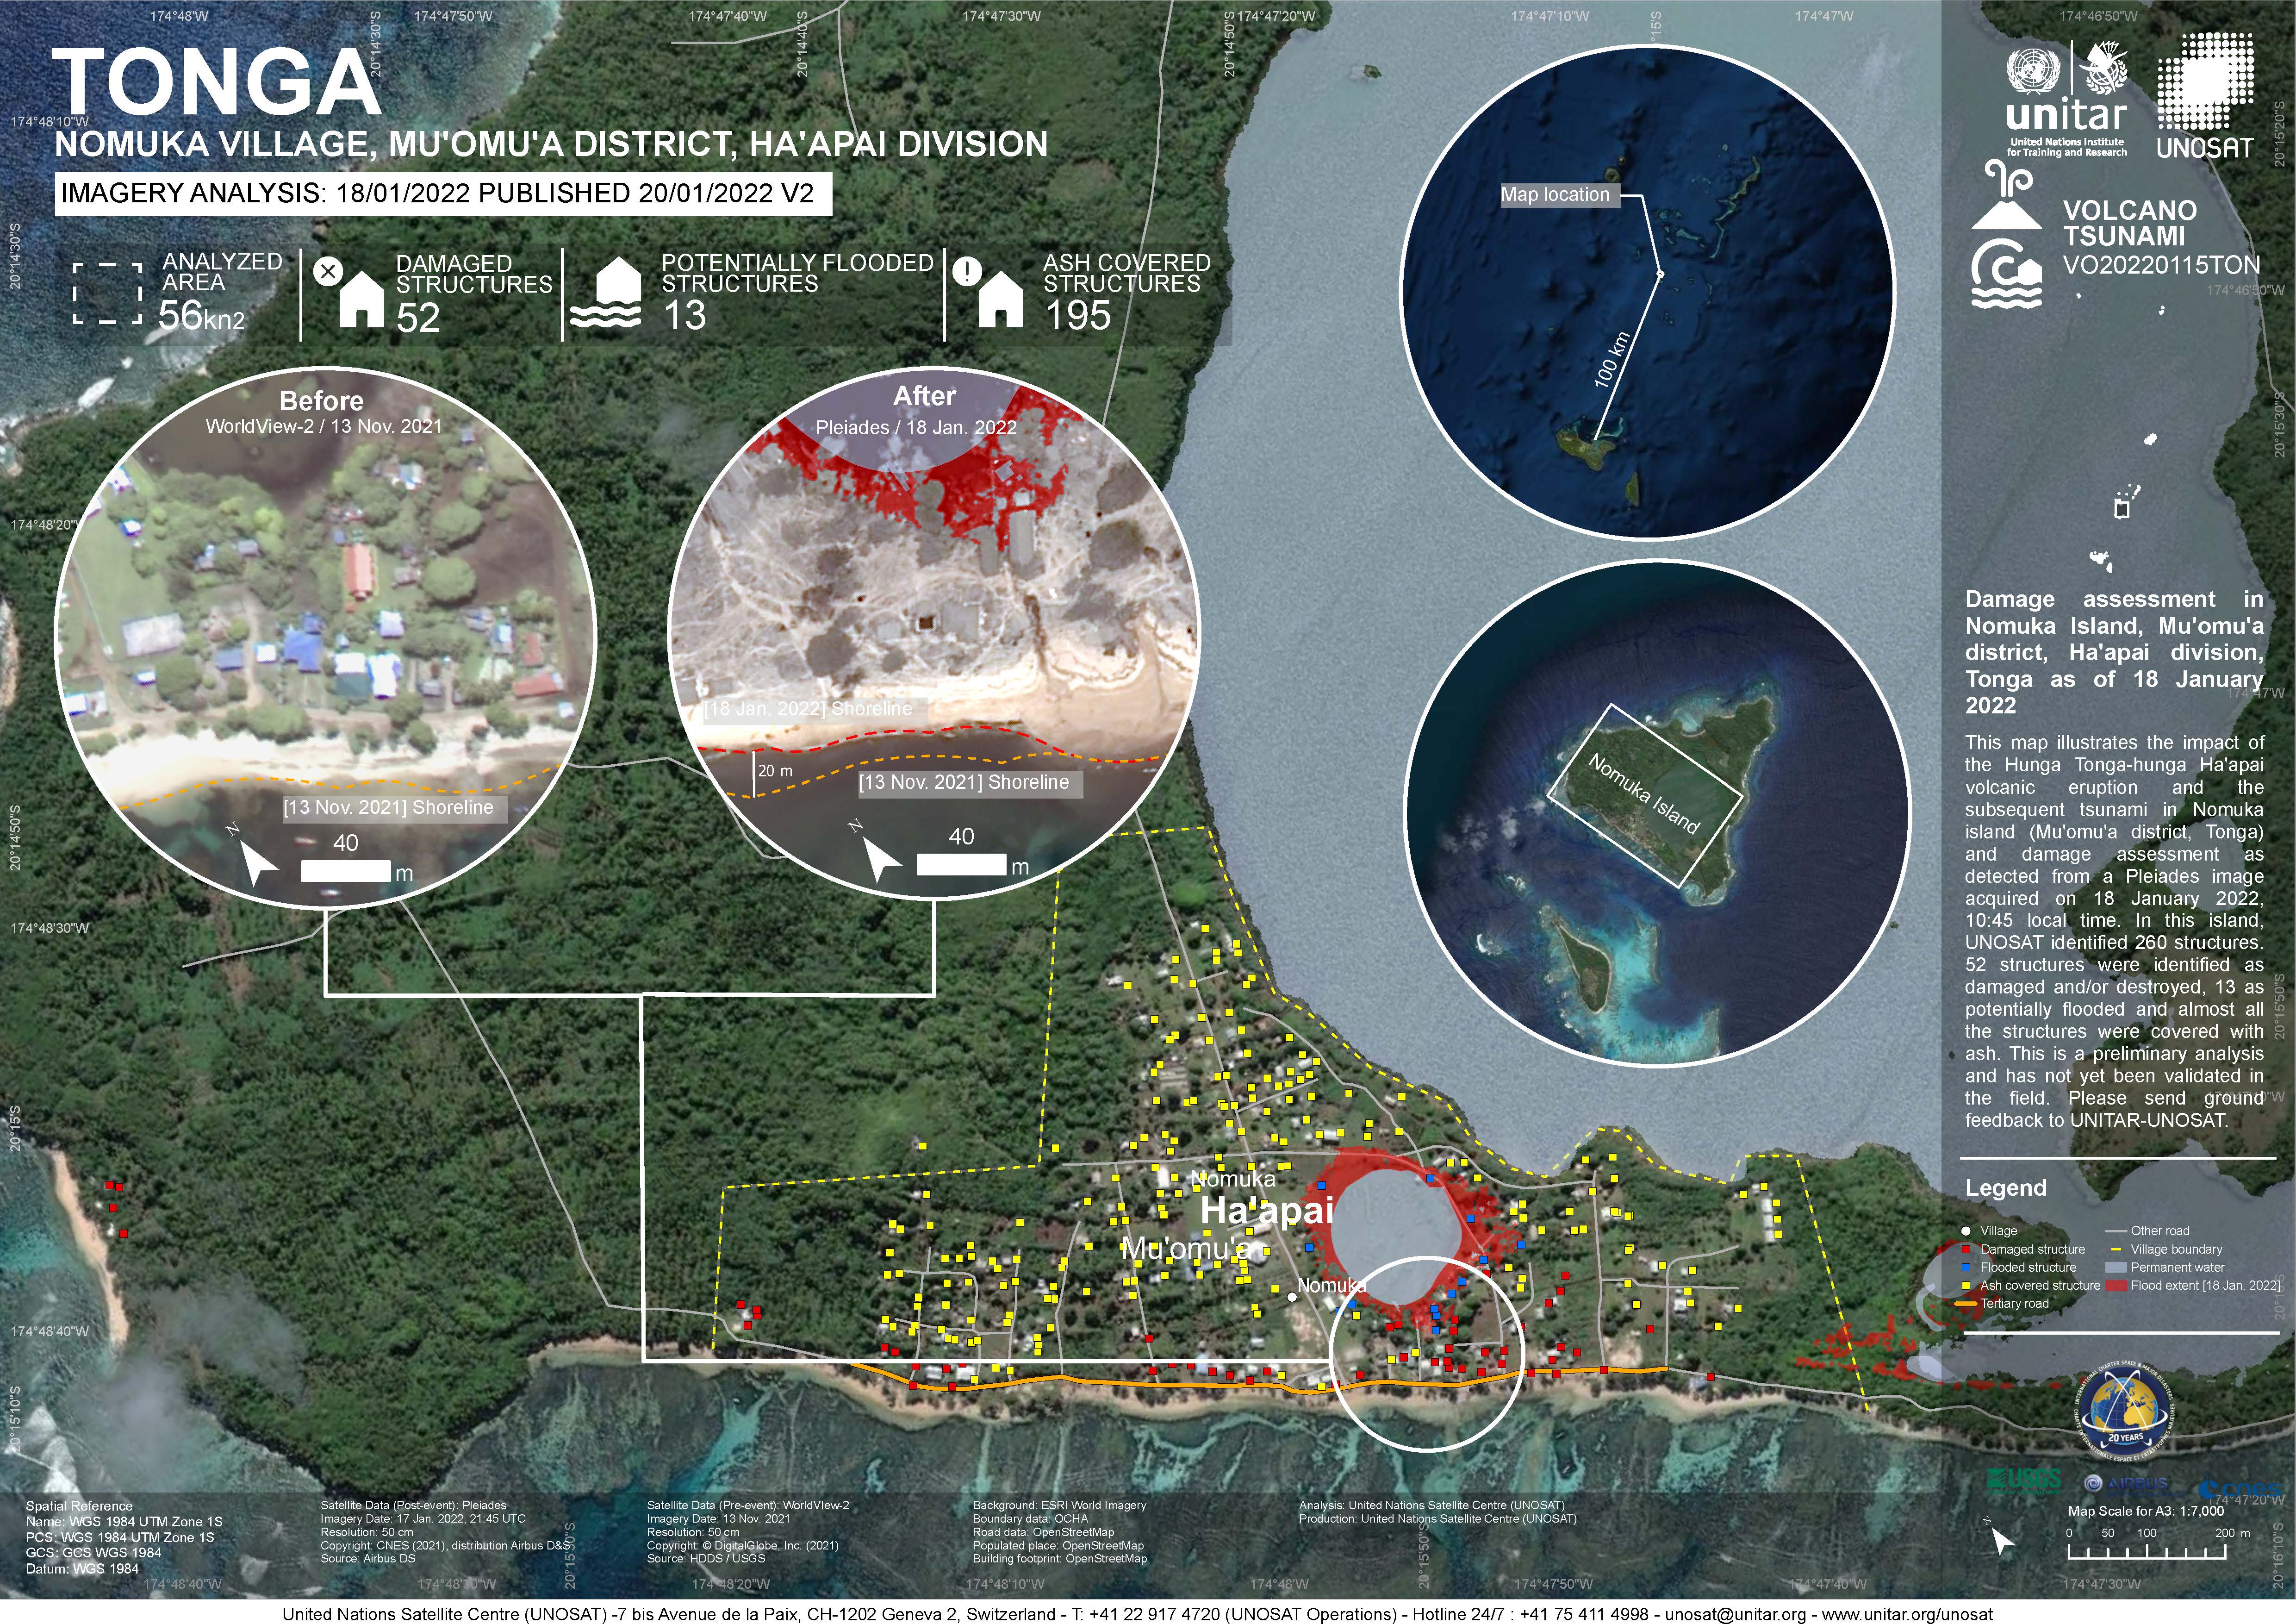
Damage assessment as detected from a Pleiades image acquired on 18 January 2022 in Nomuka Island (Mu'omu'a district, Tonga).
260 structures identified, 52 structures were identified as damaged and/or destroyed, 13 as potentially flooded and almost all structures were covered with ash. This is a preliminary analysis and has not yet been validated in the field
The map shows landcover and vegetation impact of the Hunga Tonga Hunga Haápai volcanic eruption on the Tonga Island group.
The maps highlights areas with significant shift in the shoreline by overlaying shoreline data from Nov 2021 and January 2022
The maps highlights areas with significant shift in the shoreline by overlaying shoreline data from Nov 2021 and January 2022
Bio-ORACLE is a set of GIS rasters providing geophysical, biotic and environmental data for surface and benthic marine realms. The data are available for global-scale applications at a spatial resolution of 5 arcmin (approximately 9.2 km at the equator).
Linking biodiversity occurrence data to the physical and biotic environment provides a framework to formulate hypotheses about the ecological processes governing spatial and temporal patterns in biodiversity, which can be useful for marine ecosystem management and conservation.
Map of the protected areas for the Pacific Islands Region with regional-level summary statistics on the amount of area under protection, count for each type of protected area (terrestrial or marine), and the count of their designation.
Raster data representing the mean levels of calcite in µmol/m3 for the surface water layer. The data are available for global-scale applications at a spatial resolution of 5 arcmin (approximately 9.2 km at the equator).
Marine data layers for present conditions were produced with climate data describing monthly averages for the period 2000–2014, obtained from pre-processed global ocean re-analyses combining satellite and in situ observations at regular two- and three-dimensional spatial grids.
Raster data representing the mean levels of current velocities in meters/second for the surface water layer. The data are available for global-scale applications at a spatial resolution of 5 arcmin (approximately 9.2 km at the equator).
Marine data layers for present conditions were produced with climate data describing monthly averages for the period 2000–2014, obtained from pre-processed global ocean re-analyses combining satellite and in situ observations at regular two- and three-dimensional spatial grids.
Raster data representing the mean levels of iron in µmol/m3 for the surface water layer. The data are available for global-scale applications at a spatial resolution of 5 arcmin (approximately 9.2 km at the equator).
Marine data layers for present conditions were produced with climate data describing monthly averages for the period 2000–2014, obtained from pre-processed global ocean re-analyses combining satellite and in situ observations at regular two- and three-dimensional spatial grids.
Raster data representing the mean levels of pH for the surface water layer. The data are available for global-scale applications at a spatial resolution of 5 arcmin (approximately 9.2 km at the equator).
Marine data layers for present conditions were produced with climate data describing monthly averages for the period 2000–2014, obtained from pre-processed global ocean re-analyses combining satellite and in situ observations at regular two- and three-dimensional spatial grids.
Raster data representing the mean levels of photosynthetically active radiation (PAR) in E/m2/year for the surface water layer. The data are available for global-scale applications at a spatial resolution of 5 arcmin (approximately 9.2 km at the equator).
Marine data layers for present conditions were produced with climate data describing monthly averages for the period 2000–2014, obtained from pre-processed global ocean re-analyses combining satellite and in situ observations at regular two- and three-dimensional spatial grids.
Reefs at Risk Revisited is a high-resolution update of the original global analysis, Reefs at Risk: A Map-Based Indicator of Threats to the World’s Coral Reefs. Reefs at Risk Revisited uses a global map of coral reefs at 500-m resolution, which is 64 times more detailed than the 4-km resolution map used in the 1998 analysis, and benefits from improvements in many global data sets used to evaluate threats to reefs (most threat data are at 1 km resolution, which is 16 times more detailed than those used in the 1998 analysis).
This document is a review of the status, trends and threats to Tonga’s unique biodiversity since the inception of its own NBSAP in 2006. The review also covers the status of the implementation of objectives and action plans, sectors and cross sector collaboration.
Final draft document of the national water and coastal management plan for Vavau
This is part of the "Preparation of Diagnostic Study to Inform an Integrated Coastal Management Plan for Tongatapu, Tonga" - this document represents Deliverable 3 : Coastal Characteristics and Issues Report
This vulnerability assessment provides evidence for the Government of Tonga and the people of Lifuka Island to make informed decisions about adapting to coastal erosion and sea-level rise. This project also aimed to be a blueprint for other low-lying nations considering adaptation options.